
Figures & data
Table 1. Nest features, nest-site features, and egg measures of Grassland Sparrow (Ammodramus humeralis) in grazed grasslands in central-eastern Argentina. Values are reported as mean ± SD (standard deviation) and range
Figure 1. Distribution of Grassland Sparrow nests initiated every month during three breeding seasons (2017–2020) in a natural grassland in Buenos Aires province, Argentina
Figure 2. Profile scheme of Grassland Sparrow nest (A), empty nest (B), clutch with four eggs (C) and 6-day old nestling (D). Figures A, B and D taken by MAC. Picture C taken by E. Grim
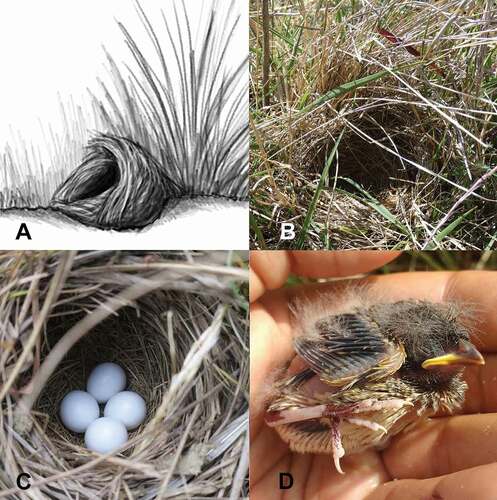
Table 2. Richard’s growth curve parameters for tarsus, wing chord, and body mass of Grassland Sparrow nestlings. Only nestlings with three or more measures were used (N = 15 nestlings from six nests). A = upper asymptote, ti = time (in days) when maximum growth was reached, K = maximum relative growth rate; d = shape parameter, and RD = residuals’ standard deviation for the predicted curve. Other values are reported as mean ± SD
Figure 3. Growth curves of Grassland Sparrow nestlings for tarsus, wing chord and body mass. Curves were fitted to a Richard’s equation using non-linear mixed models. Black dots represent the real measures obtained from nestlings (N = 15 nestlings from six nests)
Table 3. Ranking of models explaining daily nest survival of the Grassland Sparrow in central-eastern Argentina, including a null model of constant survival (S (.)). K = number of parameter estimates, Deviance = likelihood difference between each model and the saturated model (hypothetic model with perfect fit), AICc = Akaike’s Information Criterion corrected for small sample size (lower means more support), ∆AICc = difference in AICc units between a model and the best model, wi = model importance weight. We only present models within two AICc units from the best model