Figures & data
Figure 1. Map of Brazil locating Paraiba state and the study area map (Fazenda Tamanduá). In details a google map of Fazenda Tamandua with the successional stages sites points. Historical series of annual rainfall (mm), accumulated precipitation from January to April (mm) and annual average air temperature (°C) over the last 10 years in the tropical dry forest (Santa Terezinha, Paraíba, Brazil)
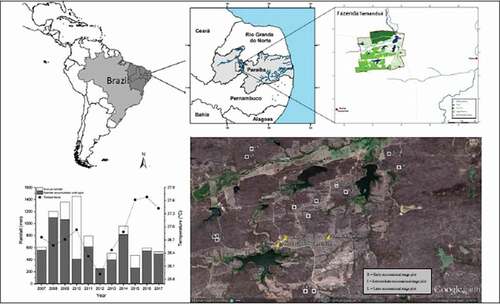
Figure 2. General view of late-successional stage of Seasonally dry tropical forest (Caatinga) at rainy season (a); Aspidosperma pyrifolium (Apocynaceae) and a branch with leaves and green fruits in details (b) and Cenostigma pyramidale (Fabaceae) and the leaves in details (c)
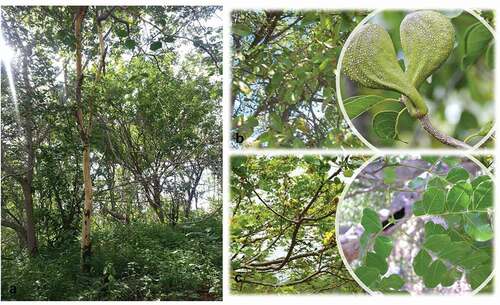
Table 1. Multivariate analysis of variance (MANOVA) of functional leaf traits: specific leaf area (SLA), leaf density (DEN), leaf thickness (THICK), total phenolic compounds (PC), nutrient content (N, P, K, N:P), and leaf tissue lost to herbivory (HERB) in tropical dry forest (Santa Terezinha, Paraíba, Brazil)
Figure 3. Leaf tissue lost to herbivory for Aspidosperma pyrifolium (a) and Cenostigma pyramidale (b) individuals from early and late succession stages of tropical dry forest over two consecutive years (Santa Terezinha, Paraíba, Brazil). Bars ± standard error followed by similar letters indicate a non-significant difference according to the Bonferroni test (5%), n = 10
Figure 4. Leaf traits for Aspidosperma pyrifolium and Cenostigma pyramidale individuals from early and late succession stages of tropical dry forest over two consecutive years (Santa Terezinha, Paraíba, Brazil). (a; b) specific leaf area; (c; d) leaf density; (e; f) leaf thickness; (g; h) phenolic compounds. Bars ± standard error followed by similar letters indicate a non-significant difference according to the Bonferroni test (5%), n = 10
Table 2. Leaf nitrogen, phosphorus and potassium content, and N:P ratio for Aspidosperma pyrifolium and Cenostigma pyramidale individuals from early and late succession stages of tropical dry forest over two consecutive years (Santa Terezinha, Paraíba, Brazil). Averages ± standard error followed followed by similar letters indicate a non-significant difference according to the Bonferroni test (5%), n = 10
Figure 5. Principal component analysis of the data collected from Aspidosperma pyrifolium (a) and Cenostigma pyramidale (b) in the tropical dry forest (Santa Terezinha, Paraíba, Brazil). Early stage (circle), late stage (square). The size of the symbols represents leaf tissue lost to herbivory. Specific leaf area (SLA), leaf density (DEN), leaf thickness (THICK), total phenolic compounds (PC) and nutrient content (N, P, K, N:P)