
Figures & data
Figure 1. Phylogenetic trees resulting from the analysis of data sets of 4202 aligned bp (POY) and 3535 aligned bp (MAFFT) and composed of the mitochondrial genes 12S and 16S, and fragments of the nuclear protein-coding genes RAG1 and Tyr. (a) Maximum parsimony optimal tree of 10,427 transformations. Numbers above branches indicate Goodman–Bremer values, and those under branches are jackknife proportions. (b) Maximum likelihood optimal tree (log likelihood −47,278.957778) and bootstrap node values
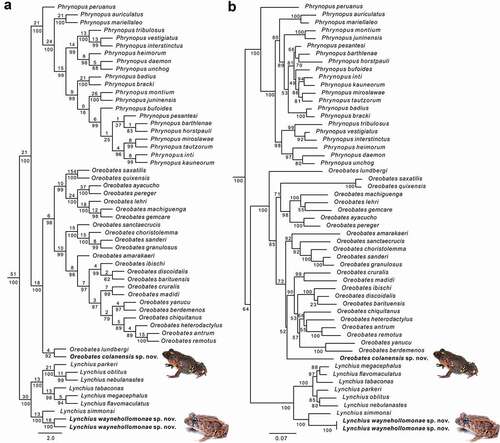
Figure 2. Two living adult males of Lynchius waynehollomonae sp. nov. (a-c) Dorsolateral, dorsal and ventral views of holotype, CORBIDI 20765, 27.3 mm SVL. (d-f) Dorsolateral, dorsal and ventral views of the paratype, CORBIDI 20778, 24.9 mm SVL. Photographs by Axel Marcheli
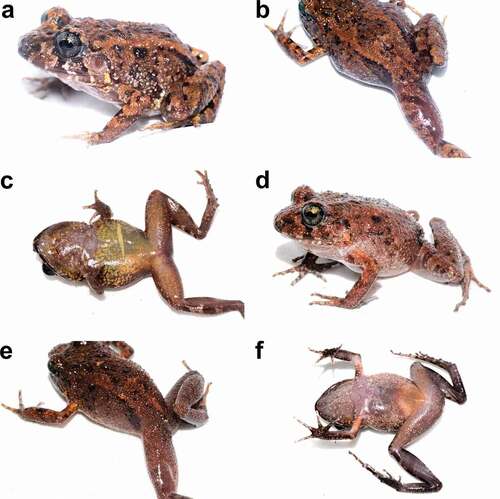
Figure 3. Preserved Lynchius waynehollomonae sp. nov. (holotype) in dorsal view (a), ventral view (b), palm (c), sole (d), and head in lateral view (e). scale 5 mm. Photographs by LAGA
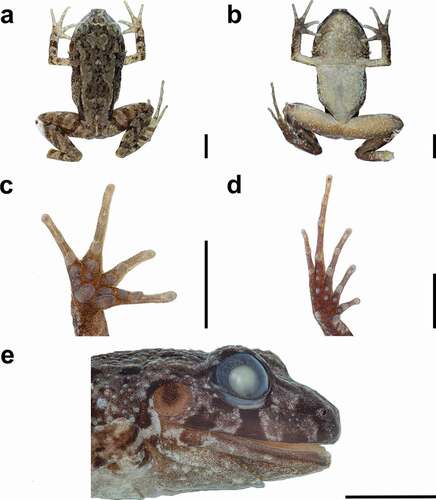
Table 1. Variation of measurements (in mm) and proportions of the type series of Lynchius waynehollomonae. See text for abbreviations
Figure 4. Distribution of species of the genus Lynchius in Ecuador and Peru. Green circles with black center are major cities for reference
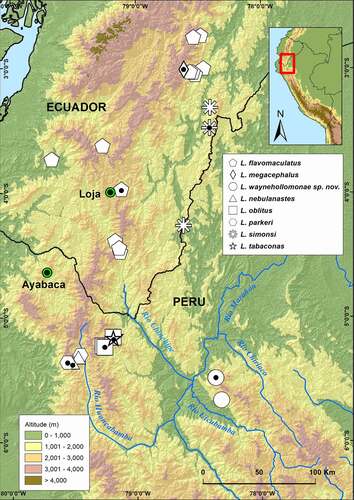
Figure 5. Two living adult males of Oreobates colanensis sp. nov. (a) Dorsolateral view, (b) lateral view showing the pattern on hidden surfaces, (c) dorsal view showing the pattern on the posterior surface of thighs, and (d) ventral view of holotype, CORBIDI 21191, 21.9 mm SVL. (e-f) Dorsolateral and ventral views of the male paratype, CORBIDI 21295, 22.5 mm SVL. Photographs by Axel Marcheli
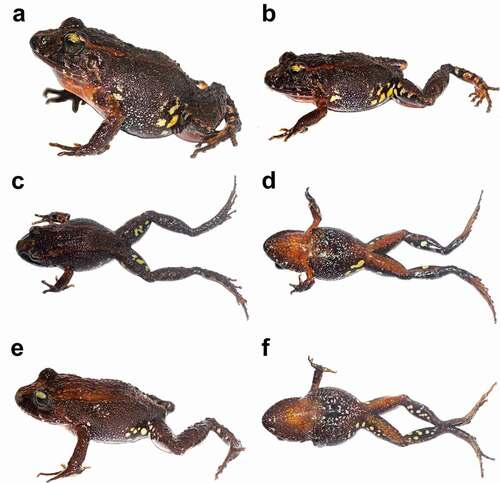
Figure 6. Preserved Oreobates colanensis sp. nov. (holotype) in dorsal view (a), ventral view (b), palm (c), sole (d), and head in lateral view (e). Scale 5 mm. Photographs by LAGA
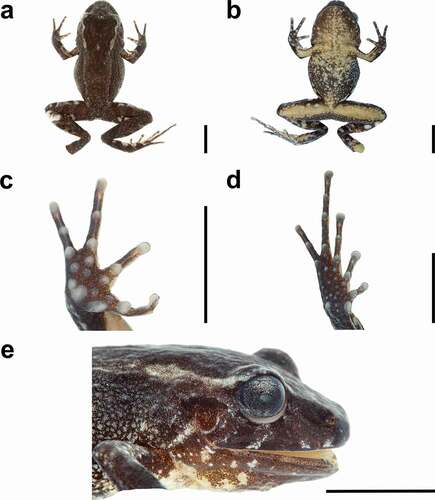
Table 2. Variation of measurements (in mm) and proportions of the type series of Oreobates colanensis. See text for abbreviations
Figure 7. Distribution of Andean species of the genus Oreobates. Green circles with black center are major cities for reference. Green circles with black center are major cities for reference
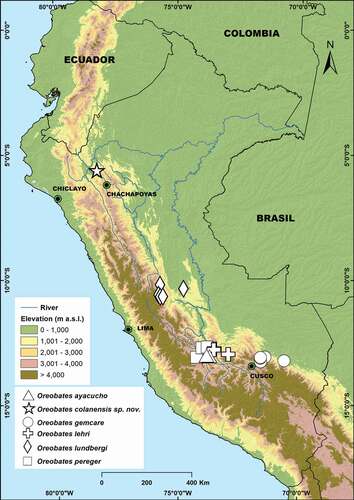
Table.A1. Genbank accession numbers of species sampled in this study. Sequences produced in this study are highlighted in bold font