Figures & data
Figure 1. Climatic envelope of 17 species of Polylepis in the central Andes as a function of: a) mean annual precipitation vs. mean annual temperature, b) maximum temperature of warmest month vs. minimum temperature of coldest quarter, and c) precipitation of driest quarter vs. precipitation of wettest quarter in the central Andes used for species distribution models
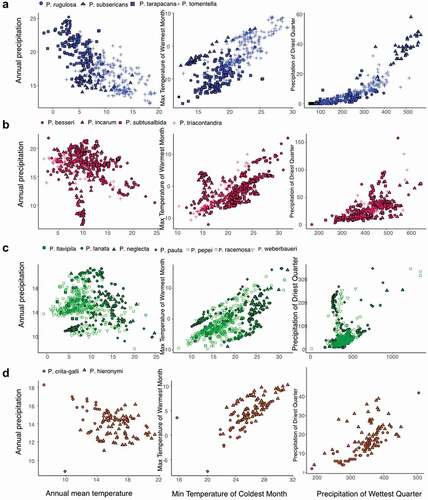
Table 1. Most explanatory variables for model fit, according to the jackknife test of Maxent for 17 Polylepis species in the central Andes
Figure 2. Potential distribution maps for 17 species of Polylepis in the central Andes generated with Maxent under the Last glacial Maximum (~22,000 yr BP) on the left, the mid-Holocene (~6,000 yr BP) center, and current conditions (1,970–2,000) on the right. Areas where probability of occurrence was predicted by only one climate scenario are indicated with the lightest color (1), areas predicted by two climate scenarios are indicated with an intermediate color (2), while areas where probability of occurrences were predicted by three climate scenarios are depicted with the darkest color (3)
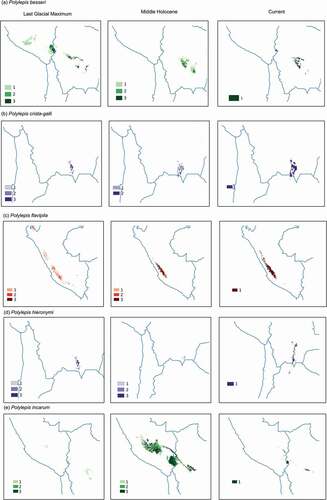
Figure 2. (Continued)
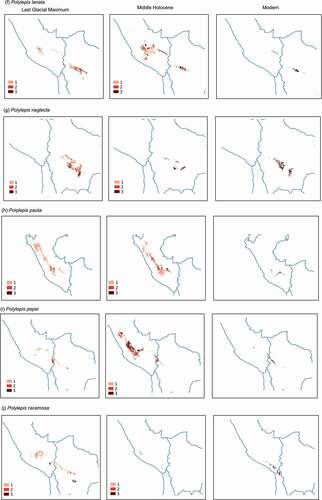
Figure 2. (Continued)
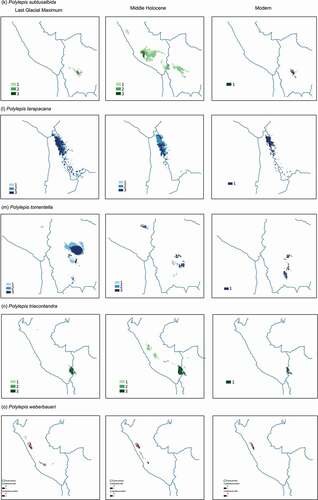
Table 2. Predicted distribution change (%) under three different climate scenarios for 17 Polylepis species in the Last Glacial Maximum (22,000 yr BP) and the middle Holocene (6,000 yr BP) relative to the present-day distribution area
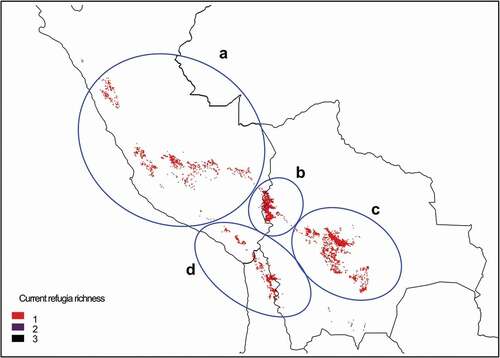
Figure 3. Centers of current refugia for 17 species of Polylepis in central Andes, based on habitat suitability generated with Maxent. Current refugia are defined as the intersection of areas classified as suitable habitat over the Last Glacial Maximum, mid Holocene and Anthropocene. Highlighted areas show climate refugia for a) central Cordillera of Peru, b) Lake Titicaca basin, c) western Cordillera of Bolivia, and d) semiarid Andes of Chile . Areas where probability of occurrence was predicted by only one climate scenario are indicated with the lightest color (1), areas predicted by two climate scenarios are indicated with an intermediate color (2), while areas where probability of occurrences were predicted by three climate scenarios are depicted with the darkest color (3)