Figures & data
Figure 1. Location of sampled sites: Nearshore were at 9.26 km (red dots), and offshore at 27.78 km (black dots) from the coast. The diamonds represent the sites influenced by river discharges. This study was carried out in the following sites: Esmeraldas (ESM; –79.755828, 0.985231), Galera San Francisco Marine Reserve (GSFMR; –80.178535, 0.716439), Cojimies (COJ; –80.125645, 0.365199), Puerto Cabuyal (CAB; –80.486416, –0.299634), Manta (MAN; –80.925100, –0.974820), Machalilla (MAC; –80.897793, –1.554898), Salinas (SAL; –81.058012, –2.224775), Gulf of Guayaquil (GUA; –80.361911, –2.849038) and Puerto Bolivar (PBO; –80.169622, –3.279350)
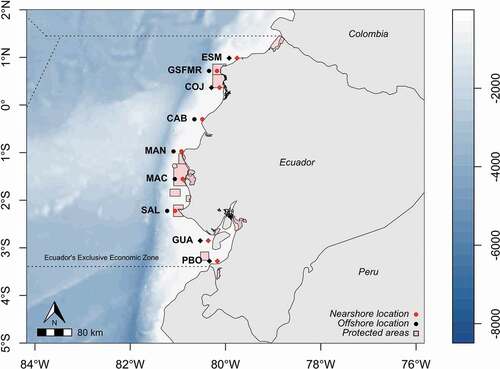
Table 1. Chl a (mg m−3) and SST (oC) mean, minimum and maximum values recorded for both the nearshore and offshore study sites. Minimum and maximum values are in parenthesis
Figure 2. Raw monthly time series data for Chl a and SST from 2003 to 2017 for the nearshore and offshore study sites
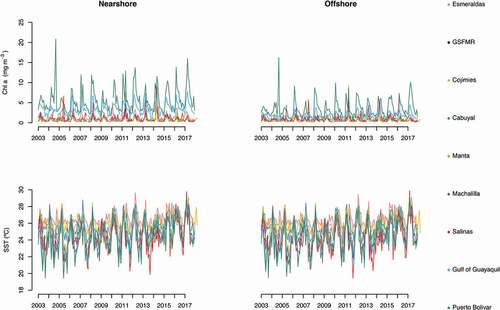
Figure 3. Variation in the concentration of Chl a (mg m−3) and SST (°C) for the nine sites studied along the Ecuadorian coast. Sites position on the y axis are ordered based on their latitudinal location along the coast of Ecuador: Top, northern sites; Bottom, southern sites. NS: nearshore; OS, offshore. The light blue boxes represent the sites influenced by river discharge
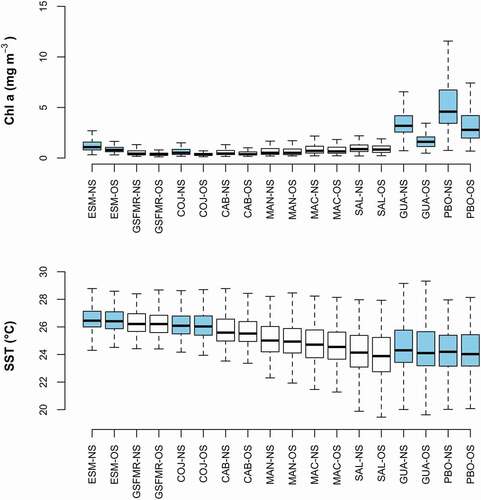
Table 2. Kruskal–Wallis significance test for the concentration of Chl a at nearshore and offshore study sites. Significant differences are marked in bold
Table 3. Kruskal–Wallis significance test for the differences in SST between locations. Significant differences are marked in bold
Figure 4. Decomposed yearly trends in Chl a concentration and SST across the nine study sites
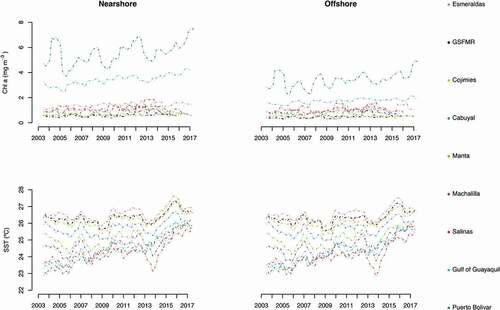
Table 4. Mann-Kendall trend significance test for the concentration of Chl a and SST in both inshore and offshore locations. Significant differences are marked in bold
Figure 5. Annual (upper) and monthly (lower) variations in Chl a concentration (mg m−3) and SST (°C) at the 9 study sites. Monthly variations are expressed in anomaly scales
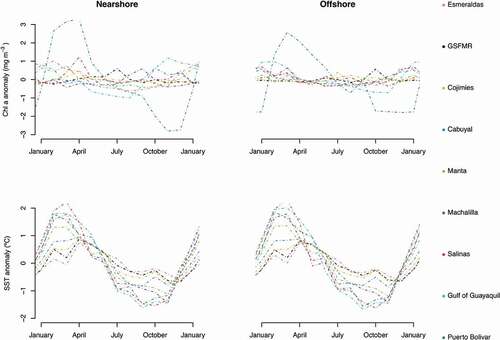
Figure 6. LOWESS scatter plots of the relationship between Chl a (mg m−3) and SST (°C) for the nearshore study sites