
Figures & data
Figure 1. Map of Honduras and surrounding countries showing D. monticola sampling points. One point may represent multiple localities
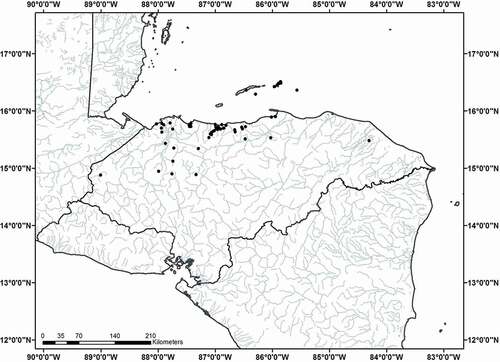
Table 1. Summary of % contribution based on abundances of food items (e.g. functional groups) found in stomachs of 120 D. monticola in three standard length size classes categories
Figure 2. Results of the NMDS (stress 20.7%). Small-size = individuals between 20 and 59 mm in SL, medium-size = individuals between 60 and 100 mm SL and large-size = individuals larger than 100 mm Sl. Labels depict the 14 functional groups in which food items were clustered
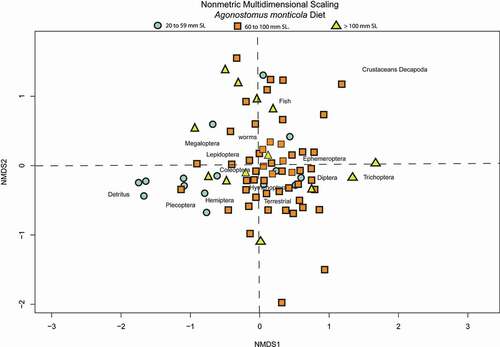
Figure 3. Dajaus monticola museum and field collection size frequency data. Monthly abundance data was ln+1 transformed to normalize for abundance disparity
Figure 4. Pie chart depicting the porcentage of food items by fuctional group utilize per D. monticola size caterogy
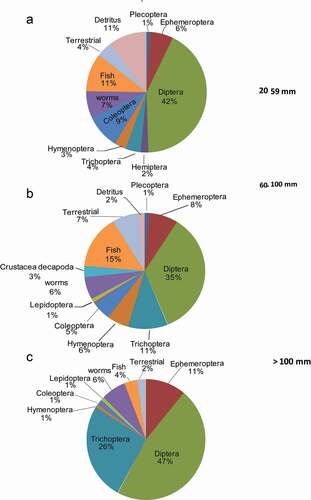
Table 2. Results of the indicator species analysis for the three size class categories. Small-size = 20–59 mm SL; medium-size = 60–100 mm SL; larger-size = < 100 mm SL. Significance values determined based on 1000 permutations. Statistically significant prey items (<0.05) are bolded. Note that indicators values below 0.5 are considered as poor indicators (Punchi-Manage et al. 2013)