Figures & data
Table 1. Values of the main characteristics of the streams (mean ± standard deviation) in control reference (CR), intensive agriculture and dairy production (AD) and urban sites (U). TP: Total Phosphorus, TN: Total Nitrogen, TDS: Total Dissolved Solids, k: specific conductivity (corrected at 25°C), DO: Dissolved Oxygen. Letters indicate post hoc (Bonferroni adjust) comparison procedure, and different letters indicate significant differences (α < 0.05)
Figure 1. Study area, above is the location at the Uruguayan level. CR: control reference sites are identified in blue, AD: intensive agriculture and dairy production sites are identified in Orange, and U: urbanization sites are identified in red. Three streams are shown below as an example of each of the three selected land uses: del Ombú stream CR, Sauce stream AD, and Salada stream U.
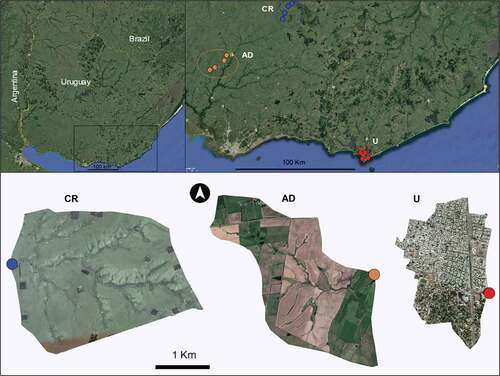
Figure 2. Principal component analysis (PCA) of water quality variables in different land use types in the study area. Sampling sites: CR control reference sites are identified in blue, AD: intensive agriculture and dairy production sites are identified in Orange, and U: urbanization sites are identified in red. NT: total nitrogen, K: specific conductivity (corrected at 25°C), OD: dissolved oxygen.
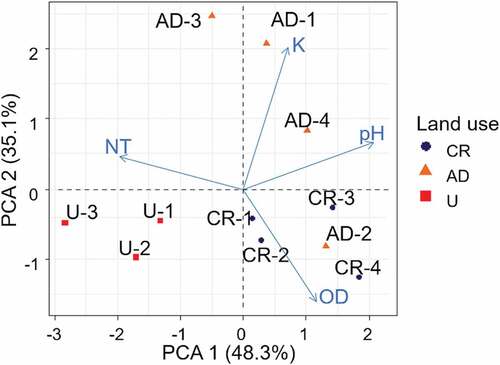
Table 2. Mean and standard deviation for the total abundance of aquatic macroinvertebrates, for each land use: control reference (CR), intensive agriculture and dairy production (AD) and urban (U)
Figure 3. Attributes of the macroinvertebrate community. (a): Total abundance; (b): Order richness; (c): Shannon diversity index. Letters indicate post hoc (Bonferroni adjust) comparison procedure, and different letters indicate significant differences (α < 0.05).
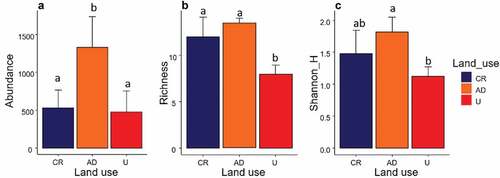
Figure 4. Non-metric Multidimensional Scaling (NMDS) ordination of macroinvertebrate community in different land use types in the study area. Stress: 0.071. Sampling sites: CR: control reference sites, AD: intensive agriculture and dairy production sites, and U: urbanization sites.
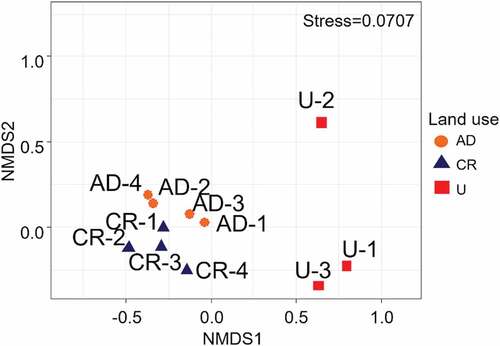
Table 3. SIMPER analyses: Percent contribution of the species by land use group
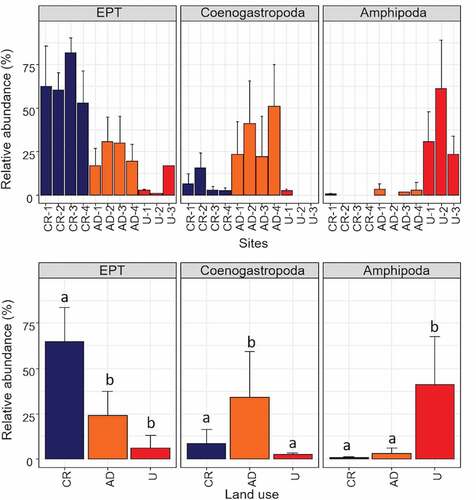
Figure 5. Relative abundance of the most influential macroinvertebrates on each site (above) and land use type (below). CR: control reference sites, AD: intensive agriculture and dairy production sites, and U: urbanization sites. Letters indicate post hoc (Bonferroni adjust) comparison procedure, and different letters indicate significant differences (α < 0.05).