
Figures & data
Figure 1. Study area showing (a) Amazon basin (black outline) and main-rivers network (light blue) and Purus river (dark blue); (b) Streams (S#1 and S#2; blue line) where caimans were monitored are affluents of the Purus River.
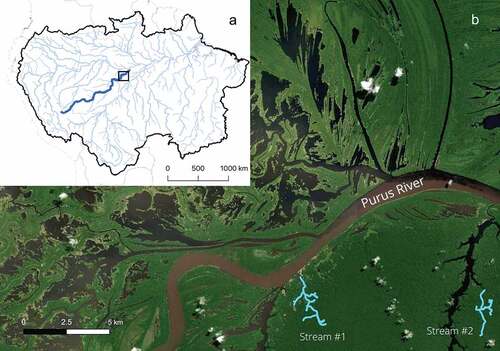
Figure 2. VHF transmitters attached to an individual before its release.
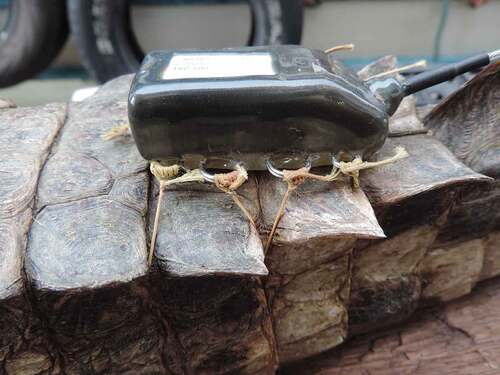
Table 1. Summary data for radio-tracked males Paleosuchus trigonatus (PT) and Paleosuchus palpebrosus (PP). Individual identification (id), species (sp), stream captured (str), snout-vent length in cm (svl), tracking start and end dates (date_start; date_end), total number of locations (total loc), locations with intervals less than 7 days (loc <7 days), total cumulative distance moved in meters (cumul), mean daily movement in meters (avg mov_day) and percentage of movements larger than 100 m per day (mov_day > 100)
Figure 3. Locations of three male Paleosuchus trigonatus in Stream #1 (a), four males in Stream #2 (b) and five male Paleosuchus palpebrosus in Stream #1 (c); dotted lines represent core areas of each individual. Total home range overlap (d) for three males of P. trigonatus (dotted lines) and three males of P. palpebrosus (unbroken lines) estimated in Stream #1. Each colour represents an individual.
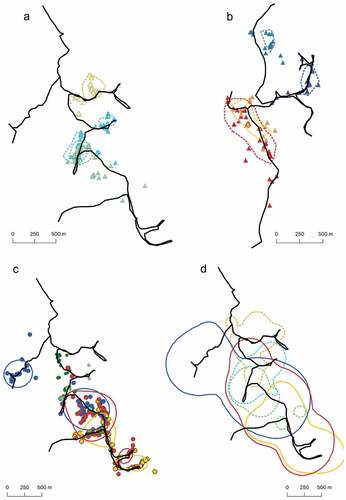
Figure 4. Variation in daily mean movement of (a) Paleosuchus palpebrosus (circles) and (b) Paleosuchus trigonatus (triangle) as a function of main-river water level during three periods: low water (white), transition (black) and high water (dark grey). Each point represents an individual location.
Table 2. Linear mixed-effect model (mov_day ~ water level:sp + size:sp ~ 1|id) showing the influence of main-river water level (WL) and body size on Paleosuchus palpebrosus (pp) and Paleosuchus trigonatus (pt) daily movements. The id term was a random effect, the rest were fixed
Figure 5. Effect of main-river water level on the distance to most downstream position (MDP – m) of A) Paleosuchus palpebrosus (circles) and B) Paleosuchus trigonatus (triangles). Lines represent linear-regression models for each male P. palpebrosus (black lines) or P. trigonatus (dotted lines).
Figure 6. Relationship between snout-vent length (cm) and (a) mean distance (m) individuals moved away from the main stream channel and (b) entire home-range size (ha) estimated using Kernel Density Estimates for Paleosuchus palpebrosus (circles) and Paleosuchus trigonatus (triangles). Each point represents an individual.
Table 3. Estimated home-range size in hectares for seven male (id) Paleosuchus trigonatus (sp-PT) and five male Paleosuchus palpebrosus (sp-PP). href95 = Kernel density estimator with 95% probability corresponding to entire area of use, href50 = Kernel density estimator with 50% probability and corresponding to core area, mcp100 = Minimum convex polygon with 100% of points registered, mcp_high = Minimum convex polygon with 100% of points registered in the high-water season, mcp_low = Minimum convex polygon with 100% of points registered in the low-water season. Individuals without estimated area did not have sufficient locations for that estimator
Table 4. Mean percentage (minimum and maximum) area overlap for three male Paleosuchus palpebrosus and three male Paleosuchus trigonatus co-existing in stream #1. over_same: mean percentage overlap over entire home range (95) and core area (50) of individuals of the same species; over_diff: mean percentage overlap over entire home range (95) and core area (50) for individuals of the other species