Figures & data
Figure 1. Fish sampling sites, Canindeyú, Paraguay. (A) outlines Canindeyú Department within Paraguay, (B) indicates Mbaracayú Forest Biosphere Reserve (gray) and Mbaracayú Forest Nature Reserve (black) within Canindeyú Department, and (C) the rivers and streams (in blue) in Canindeyú Department along with each sampling site (pink dots) and their reference code (see ); the Jejuí mi (northern branch) and Jejuí guasu (southern branch) rivers are indicated by thicker blue lines, the border of the biosphere reserve is indicated by the red line, and the forest reserve is indicated by the black line.
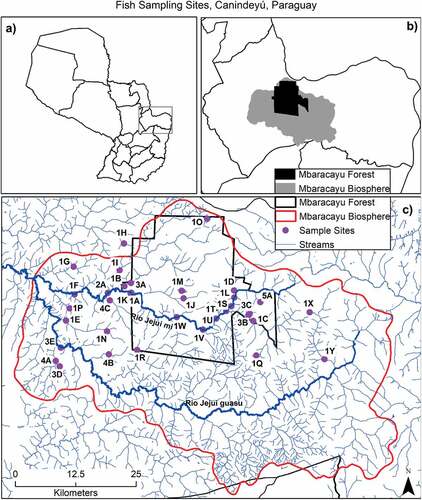
Table 1.. Sampling sites in Mbaracayú Forest Biosphere Reserve, Canindeyú, Paraguay. Listings include site code (which corresponds to locations identified on ), site name, location coordinates (latitude, longitude), watershed within which the site resides, and years a sample was collected. Sites are identified by the year in which they were first sampled: sites beginning with 1 were first sampled in 2007, 2 in 2008, 3 in 2009, 4 in 2010, and 5 in 2011
Figure 2. Photographs of sampling sites inside the Mbaracayú Forest Nature Reserve (A and B) and outside the Mbaracayú Forest Nature Reserve, but within the Mbaracayú Forest Biopshere Reserve (C and D). Locations for each site are detailed in and indicated on . Photo A is the rio Jejuí mi at Jejuí mi (5 m width, 2 m depth, 0.6 m/sec flow; site 1A), photo B is rio Jejuí mi at Horqueta mi (2.5 m width, 1 m depth, 0.3 m/sec flow; site 1 L), photo C is rio Jejuí mi at Villa Ygatimi (10 m width, 4 m depth, 0.6 m/sec flow; site 1 F), and photo D is arroyo Moko’i (2 m width, 0.5 m depth, 0.2 m/sec flow; site 1 H).
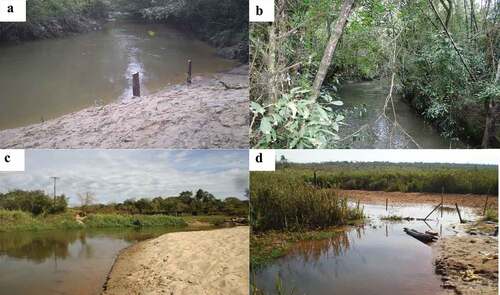
Table 2. Mean ± standard deviation for species richness, family-level diversity, functional diversity, and total number of fish collected at sites inside Mbaracayú Forest Nature Reserve compared to sites outside Mbaracayú Forest Nature Reserve from survey years 2007, 2008, and 2009
Figure 3. Comparisons of diversity measures for fishes captured inside vs. outside the Mbaracayú Forest Nature Reserve for survey years 2007, 2008, and 2009: (A) mean fish species richness (S) ± standard deviation, (B) mean family-level diversity ± standard deviation, (C) mean functional diversity ± standard deviation, and (D) mean number of individual fish collected ± standard deviation.