
Figures & data
Figure 1. Hypothesis expected of Bergmann’s rule converse for the two phyllostomid species (Carollia perspicillata and Artibeus lituratus). This statement poses an increase in body size with decreasing elevation and increasing temperature (Hypothesis 1). For both species, differences in size between males and females along the elevation is also expected (Hypothesis 2).
Figure 2. Locations of C. perspicillata and A. lituratus from Colombia. Linear regression between elevation and mean atmospheric temperature of the locations shows an inverse relation (R2 = 0.96; β = −0.0048; P < 0.0001; Std. error = 0.0002; t = −23.73; n = 26). Codes of each site are described in .
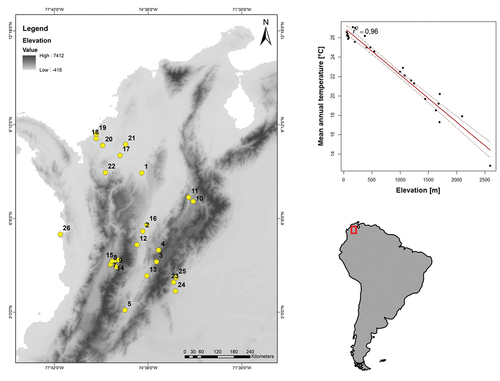
Table 1. Climatic variables of the 26 sites analyzed in the study. Sites are organized by biogeographic regions (CAPITALS) and departments (bold). Code of each site represents geographic coordinates (Appendix 2) shown in . Mean Annual Temperature (MAT), Mean Diurnal Range (MDR), Isothermality (ISO), Temperature Seasonality (TS), Max Temperature of Warmest Month (MTWM), Min Temperature of Coldest Month (MTCM), and Temperature annual range (TAR). Units of MAT, MDR, TS, MTWM, MTCM, and TAR are in °C, ISO in %, and Elevation in m
Figure 3. Relationships of standardized length of forearm and (a) elevation and (b) mean annual temperature. Red color corresponds to Carollia perspicillata and aquamarine corresponds to Artibeus lituratus.
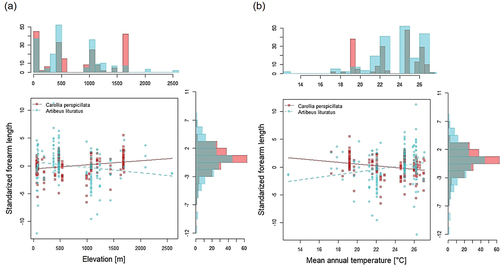
Figure 4. Comparisons of forearm length (mm) between below 1000 and above 1000 m elevation in (a) Carollia perspicillata as species (b) Carollia perspicillata males (c) Carollia perspicillata females (d) Artibeus lituratus as species (e) Artibeus lituratus males and (f) Artibeus lituratus females.
Table 2. Forearm length of specimens examined from Carollia perspicillata and Artibeus lituratus for each study site. Values of mean are in mm
Figure 5. Relationships of standardized length of forearm length and environmental variables including: (a) Elevation, (b) Mean Annual Temperature, (c) Isothermality, (d) Temperature Seasonality, (e) Mean Diurnal Range, (f) Max Temperature of Warmest Month, (g) Min Temperature of Coldest Month, and (h) Temperature annual range. For both species, “m” and “f” represent males and females, respectively.
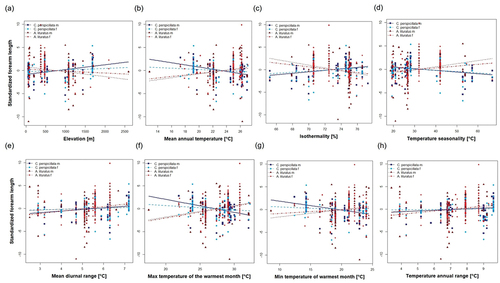
Table 3. Linear regressions between forearm length and climatic variables for each sex of Carollia perspicillata and Artibeus lituratus. Bold represents significative values (P < 0.05). Mean Annual Temperature (MAT), Mean Diurnal Range (MDR), Isothermality (ISO), Temperature Seasonality (TS), Max Temperature of Warmest Month (MTWM), Min Temperature of Coldest Month (MTCM) and Temperature annual range (TAR)