Figures & data
Table 1. Location of the sites where S. macrophylla was sampled in Ecuador
Table 2. Estimates of genetic diversity in 123 S. macrophylla based on nine SSR loci according to Ref. [Citation20]
Table 3. Descriptive statistics overall loci for each population according to Ref. [Citation20]
Table 4. Analyses of Molecular Variance (AMOVA) in six provinces of Ecuador, located on farm and natural populations of S. macrophylla.
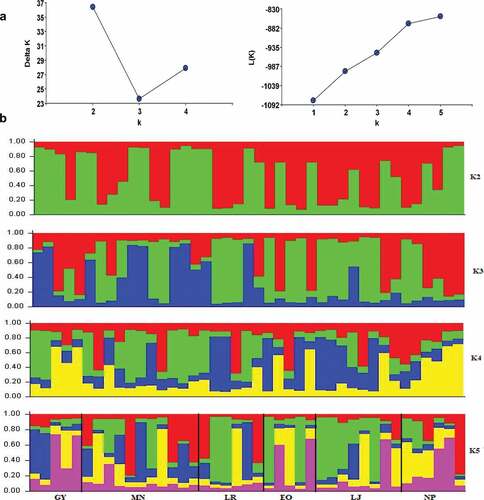
Figure 1. Genetic cluster identified by Bayesian analysis using Structure and Harvester software. (a) ∆K estimates of the posterior probability distribution of the data for a given K. Ln (K) obtained are a Structure analysis and an ad hoc quantity distribution. (b) Estimated population structure and the genetic clusters of the six provinces of Ecuador and 123 individuals of S. macrophylla. Guayas (GY), Manabí (MN), Los Ríos (LR), El Oro (EO), Loja (LJ) and Napo (NP).