
Figures & data
Table 1. Environmental variables used to create ecological niche models and their derived species distribution models.
Figure 1. Species richness (i.e. gross number of species predicted to occur) during June (left) and December (right) in Costa Rica. Legend displays values for no taxa, the summer maximum, and the winter maximum. Includes all taxa, including those removed from cluster analyses.
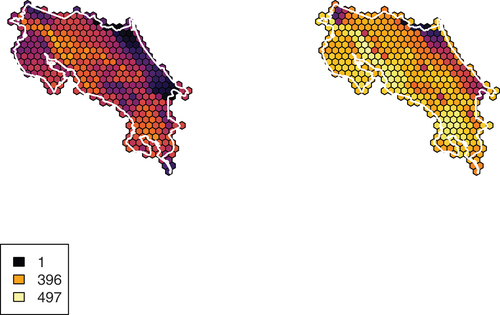
Figure 2. Beta diversity (i.e. average range size per cell) for birds in Costa Rica in June (left) and December (right). Legend displays values for no taxa, the summer maximum, and the winter maximum. Includes all taxa, including those removed from cluster analyses.
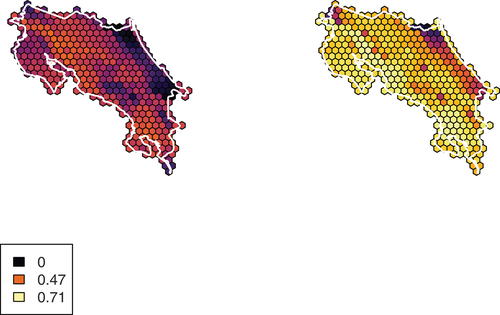
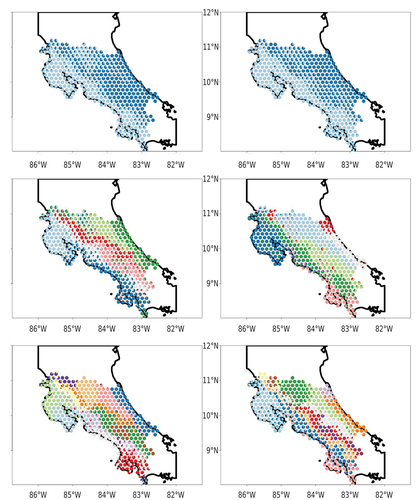
Figure 3. Plots from ecostructure showing results for June (left) and December (right) with K values of 2 (top), 7 (middle), and 13 (bottom). Note that the plots become structured in a similar fashion and display patterns reminiscent of the richness and beta diversity plots, indicating common patterns of distribution structuring the geographic motifs.
Supplemental Material
Download Zip (2.3 MB)Data availability statement
Our code files have been uploaded to Github and are available at https://github.com/jacobccooper/costa_rica_community