Figures & data
Figure 1. (A, B) Unenhanced axial CT brain images revealed complete hyper-attenuating soft tissue opacification of the expanded sphenoid and ethmoid sinuses as well as visualized maxillary antra with sinus walls destruction and infiltration into cavernous sinus bilaterally and pre pontine cistern. Dense basilar artery indicating thrombosis (red arrow).
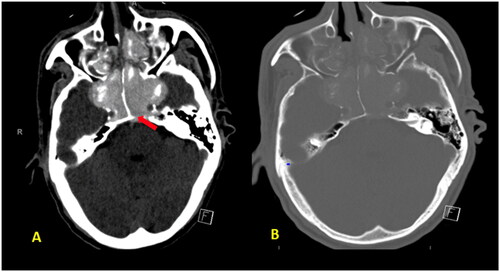
Figure 2. MRI Brain with axial diffusion restriction image (A) and apparent diffusion coefficient (ADC) (B) map shows an area of diffusion restriction in the pons (⋆) with a signal drop on the ADC, in keeping with acute pontine infarction. 3D TOF MR angiography (C, D) show complete loss of flow-related signal of the basilar artery (red arrow) indicating occlusion.
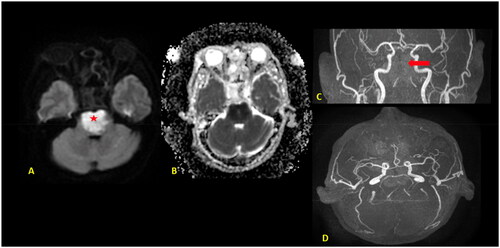
Figure 3. Intraoperative endoscopic picture showing the severely expanded sphenoid sinus with indentations of the structures surrounding it. ON: Optic nerve; CC: Cavernous carotid; SF: Sellar floor; ISS: Inter-Sinus septum; CR: Clival recess; PCC: Para clival carotid; * Opico-Carotid recess.
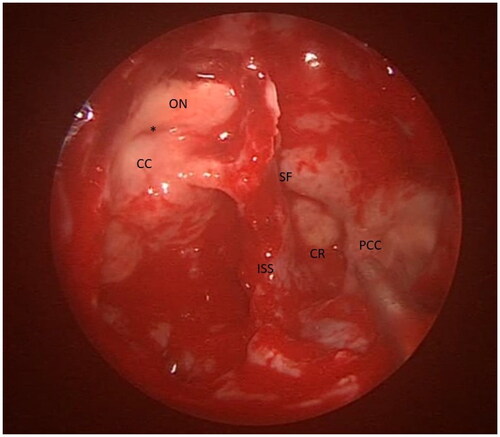
Figure 4. (A) Microscopic examination showed mucosal fragments stained with hematoxylin and eosin stain lined by respiratory mucosa. They are slightly polypoid in shape and show eosinophils surrounded by areas of lightly staining mucin sprinkled with Charcot-Leyden crystals (B) Tissue stained with grocott-–gomori methenamine silver highlights fungal elements. There are fungal elements seen within the granuloma. The fungus has slender septated hyphae, branching at an acute angle. No definite angioinvasion was observed.
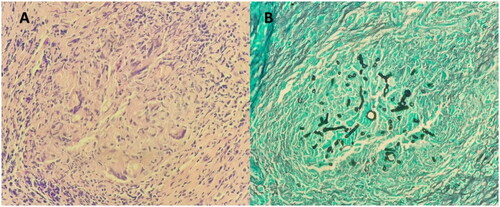
Figure 5. (A, B) Unenhanced axial CT brain images revealed hyperdense material layering within the atria of the lateral ventricle and outlining the sylvain fissures bilaterally indicating intraventricular and subarachnoid hemorrhage with subsequent acute hydrocephalus and transependymal CSF permeation.
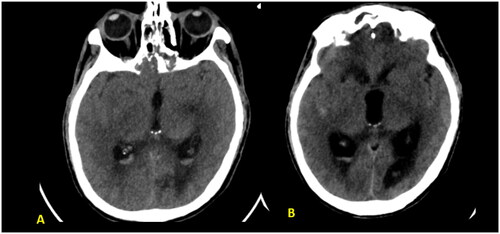
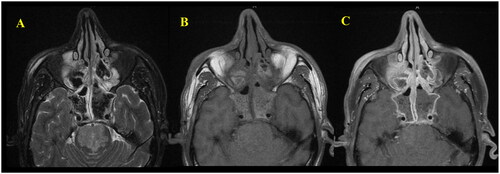
Figure 6. (A) Axial T2 FS weighted image shows markedly hypointense T2 signal of the intrasinus content primarily affecting the sphenoid and ethmoid sinuses owing to dense fungal concentration and heavy metals mimic air. (B, C) Axial T1 pre- and postcontrast images revealed peripheral enhancement of the inflamed mucosa within the affected sinuses.