Figures & data
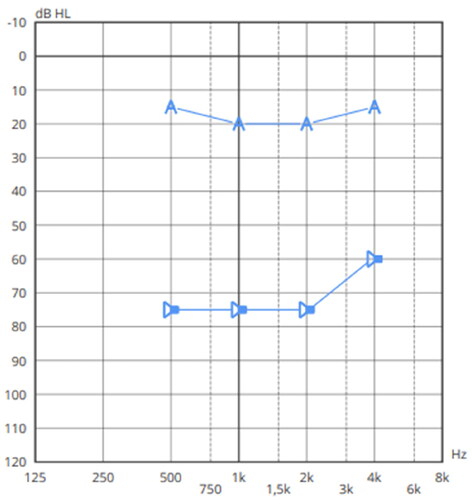
Figure 1. Pure-tone audiogram. Mild conductive hearing loss in the right ear and normal hearing in the left ear.
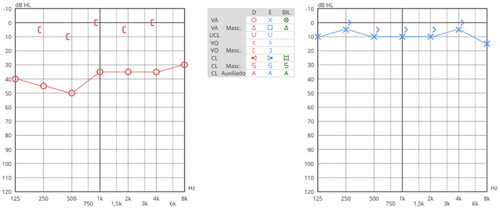
Figure 2. Results of pure tone audiometry in free field with left ear masking. The symbol 
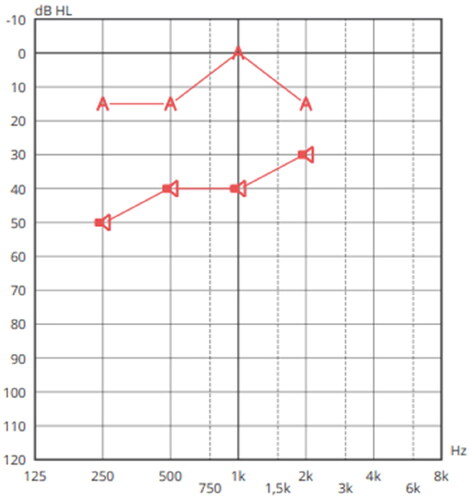
Figure 3. Pure-tone Audiometry. Normal hearing in right ear and moderate type II conductive hearing loss in the left ear.
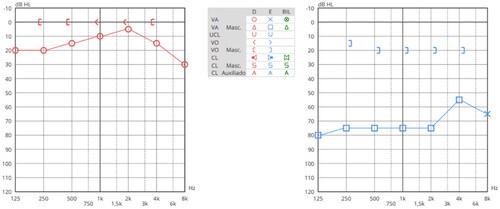
Figure 4. Pure tone audiometry in free field with masking of the right ear. The symbol