
Figures & data
Table 1. Shows an interpretation of zone diameters on Mueller–Hinton agar
Figure 1. Healthcare workers categorised by cadre (a) and contamination of mobile phones classified as smartphones and non-smartphone.
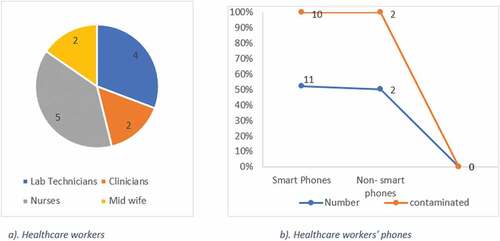
Table 2. Associated Factors to bacterial contamination of Healthcare worker’s mobile phones, n represents the total number of participants
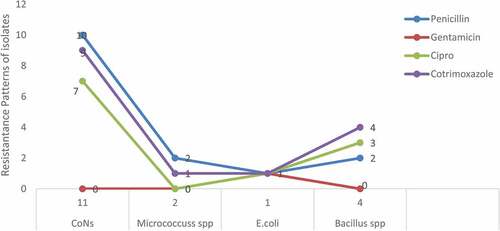
Figure 2. Bacterial isolates and resistance patterns to four commonly used antibiotics in healthcare facilities in Uganda.
Supplemental material
Supplemental Material
Download MS Word (15.1 KB)Availability of data and material
Technical appendix, statistical appendix, and dataset will be available upon formal request.