Figures & data
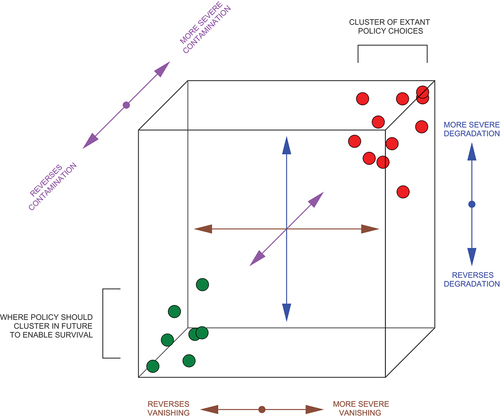
Figure 1. Estimated world human population, 10,000 BCE – 2021 CE. (License: CC-BY).
The graph shows the world population since 10,000 BCE until 2021. The population line is almost flat against the bottom of the graph until around 500 CE, then it begins a gentle rise upwards. Around 1800 the curve accelerates so quickly that on this graph, which shows such a long period of time, the last 200 years show a nearly vertical straight line.
Source: Gapminder - Population v7 (2022), Gapminder - Systema Globalis (2022), HYDE (2017), United Nations - World Population Prospects (2022) – with major processing by Our World in Data. https://ourworldindata.org/population-sources. Last updated March 31, 2023.
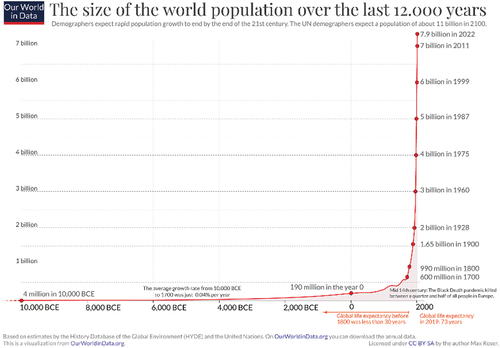
Figure 2. A visual representation of the SEDCOV rough litmus test for state actions, for use by non-scientist national security practitioners and adjacent expert communities. (Diagram designed by author, and executed and enhanced by Adie Mitchell, Princeton School of Architecture).
The diagram shows a cube in three dimensions with an x, y, and z axis delineated (with the null point in the center of the interior of the cube volume). Vanishing is assigned the horizontal x axis, in brown; degradation takes the vertical y axis, in blue, and contamination takes the z axis, in purple, represented as coming toward and away from the viewer. The more severe an act or policy is in each of these ways, the farther right, higher, and/or farther away it lies in the cube. This is where most Western policies currently lie, and there is a cluster of red dots in this right/upper/back part of the cube labelled ‘cluster of extant policy choices’.
Source: Diagram designed by author, and executed and enhanced by Adie Mitchell, Princeton School of Architecture.
Any positive, restorative policies would sit in the left, lower, and/or closer part of the cube. The diagram also includes a cluster of green dots in this left/lower/closer corner, labeled ‘where policy should cluster in future to enable survival’.