Figures & data
Table 1. Projected future trends of different climate parameters/phenomena
Figure 1. Changes in the global average surface temperature relative to 1986–2005 for the different emission scenarios (IPCC, Citation2013)
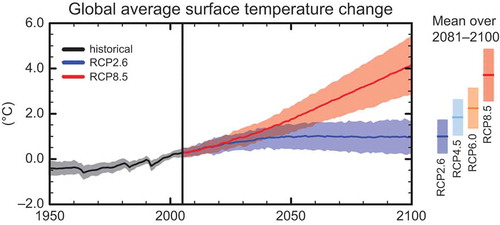
Figure 2. Method of risk identification
Table 2. Relevant climate change parameters and the affected risks. a.
Figure 3. Identified climate-change risks on bridges and the climate changes affecting them. Inside to outside: risk group, identified risk, responsible climatic change parameters. Arrows connecting the different risks represent the discussed interdependencies.b.
bD1: accelerated degradation of superstructure, D2: accelerated degradation of substructure, S1: heat-induced damage to pavements and railways, S2: increased long-term deformations, G1: higher scour rates, G2: bridge slope failure, G3: landslides, G4: foundation settlement, G5: rockfalls; debris flows; and snow avalanches, G6: soil liquefaction, G7: additional loads on piles, G8: clay shrinkage and swelling, I1: higher wave impact, I2: wind-induced loads, I3: additional snow loads on covered bridges, I4: thermally induced stresses, I5: drainage capacity, I6: hydrostatic pressure behind abutments, I7: loads on bridges with control sluice gates, I8: loss of prestressing force, I9: ice-induced loads, A1:water vessel collisions, A2: vehicle-pier collisions, A3: vehicle accidents, A4: train-pier collisions, E1: floods, E2: storms, E3: wildfires, O1: snow removal costs, O2: temporary bridge restrictions, O3: power shortage; P↑, P↓: higher and lower precipitation in some regions, respectively, T↑: higher temperatures, W↑: more frequent/intense extreme winds, SLR: sea level rise, RH↑, RH↓: increase and decrease in relative humidity, respectively, PF↓: permafrost melt, P↔: increase in precipitation contrast, F↑: higher in-cloud liquid water content of marine fogs, CC↑: higher carbon concentrations, SR↑: higher solar radiation, OT↑: higher ocean temperature, PH↓: decrease in global ocean pH, SF↑: higher snowfall, S↑: increase in storms intensity/frequency, HW↑: increase in intensity/frequency of heatwaves, T↔: higher temperature seasonal contrast, RO↑: higher run-off, W↓: decrease in wind speeds, WL↔: increased water fluctuations in rivers, SS↑: higher soil salinity.