
Figures & data
Figure 1. Flowchart of the bibliometric analysis by using VOSviewer.
Figure 2. The bibliographic map generated using VOSviewer on bridge infrastructure resilience.
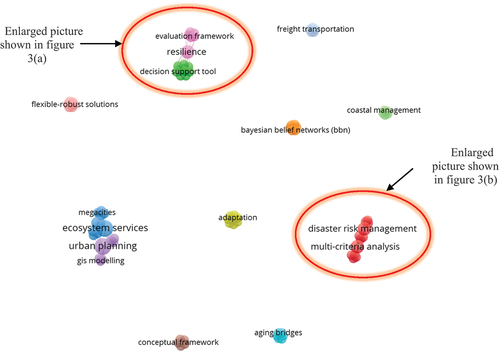
Figure 3. The bibliographic map on bridge infrastructure resilience using decision-making tools.
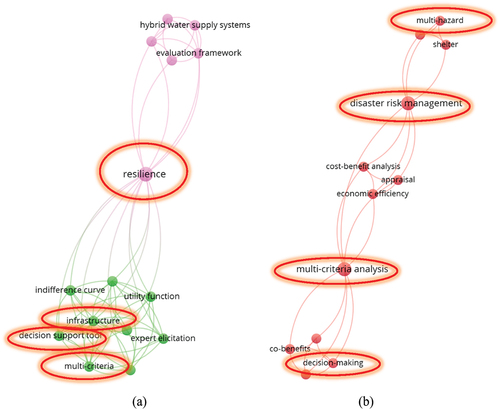
Table 1. Different infrastructure resilience index.
Figure 4. Infrastructure’s performance during its service life (modified after Sen et al., Citation2021bb).
Table 2. Key resilience factors of civil infrastructure against natural hazards (Khan et al., Citation2022).
Figure 5. Bridge infrastructure resilient hierarchy system against seismic hazard (Khan et al., Citation2022).
Table 3. Bridge infrastructure resilience parameters under reliability factor (Khan et al., Citation2022).
Table 4. Bridge infrastructure resilience parameters under-recovery factor (Khan et al., Citation2022).
Figure 6. Stages of framework for seismic resilience of bridge infrastructure.
Figure 7. Resilience Framework of a Generic HER model.
Table 5. Details of experts.
Table 6. The best and worst parameters according to different experts’ opinion (Khan et al., Citation2022).
Table 7. The rating of the best parameter over other parameters under reliability (Khan et al., Citation2022).
Table 8. The rating of the best parameter over other parameters under recovery (Khan et al., Citation2022).
Table 9. The other parameters’ priority over the worst parameter under reliability (Khan et al., Citation2022).
Table 10. The other parameters’ priority over the worst parameter under recovery (Khan et al., Citation2022).
Table 11. The weights of the parameters as per each expert under reliability.
Table 12. The weights of the parameters as per each expert under recovery.
Table 13. Resilience, reliability and recovery and all the parameters’ frame of discernment.
Figure 8. (a) Plan and elevation of the bridge, (b) Typical cross section at pier location, (c) Cross section of the pier cap beam, and (d) Cross section of the concrete pier.
Table 14. Evaluation grade of the parameters of bridge resilience.
Table
Table 15. Bridge resilience against seismic hazard.
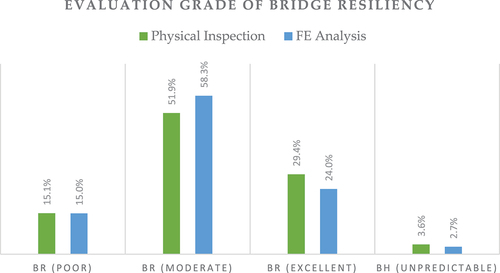
Figure 9. Bridge resilience distribution grade from two different sources of data.
Data availability statement
Some or all data, models, or code that support the findings of this study are available from the corresponding author upon reasonable request.