Figures & data
Figure 1. Hood River county, showing city limits and designated farm and residential zones.
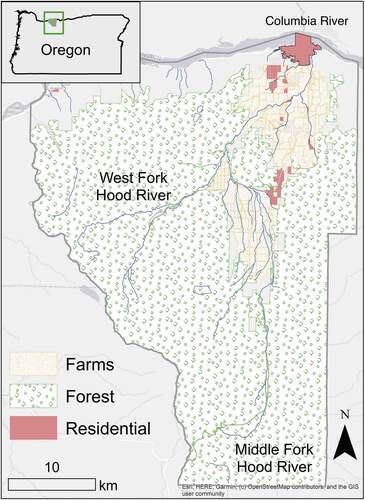
Figure 2. Diagram showing the connectivity of different stakeholders through the Hood River Watershed group based on 32 interview subjects. Lines with more weight indicate larger member cross-over between sectors.
Figure 3. Hazard priorities index according to interview subjects (Total number of respondents in parentheses).
Table 1. Topics of contention over urbanization process (low-income housing) in Hood River.
Figure 4. Different positions regarding climate change and residential development in Hood River, OR.