
Figures & data
Figure 1. Framework for integrating critical infrastructure disruption analysis with input-output model.
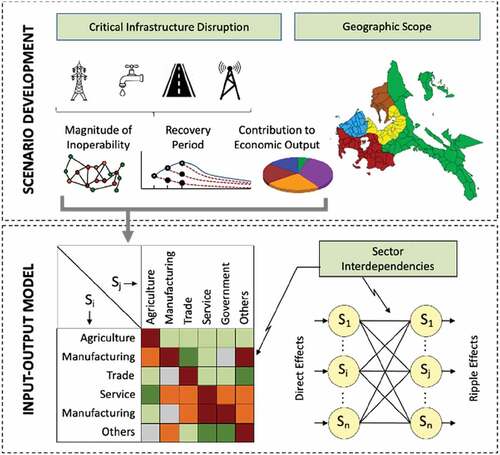
Figure 2. Map of the study region.
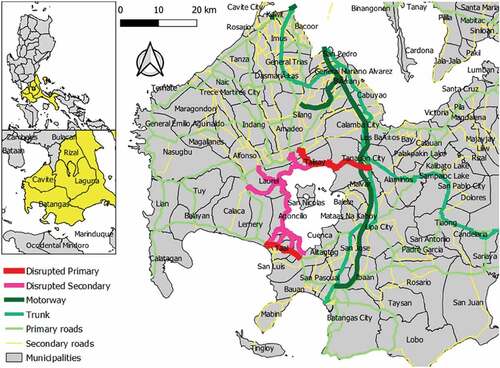
Table 1. Affected road sections, length of roads (in km) and average recovery period (in days).
Table 2. Power supply outages of the affected municipalities/cities per province, number of households in each location and estimated average recovery period (in days).
Table 3. Affected water supply, number of households and average recovery period (in days).
Table 4. Codes and descriptions of economic sectors used in the study.
Table 5. Direct disruption inputs to the DIIM based on taal volcano situation reports (Baseline scenario).
Figure 3. Inoperability and economic loss results for each infrastructure disruptions (Baseline scenario).
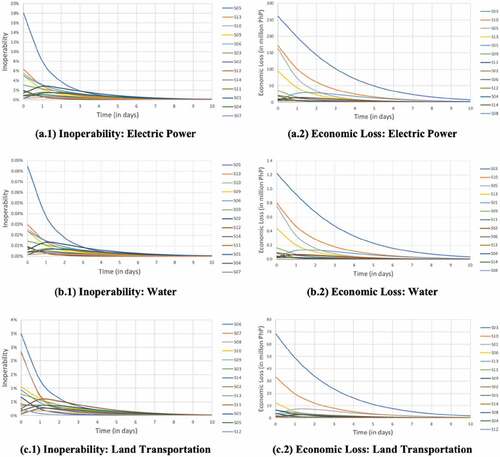
Figure 4. Inoperability results for combined critical infrastructure disruptions (Baseline scenario).
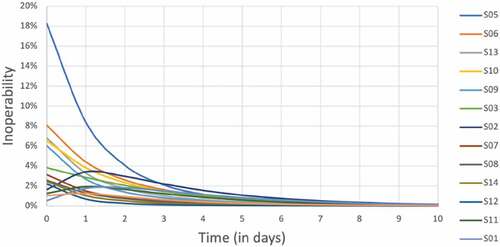
Table 6. Inoperability rankings for combined infrastructure rankings (Baseline scenario).
Figure 5. Economic loss results for combined critical infrastructure disruptions (Baseline scenario).
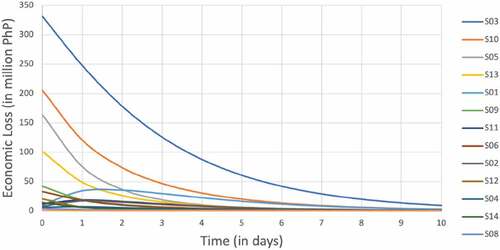
Table 7. Economic losses rankings for combined infrastructure rankings (Baseline scenario).
Table 8. Parameters used for sensitivity analysis of initial inoperability and recovery period.
Table 9. Inoperability rankings for combined infrastructure rankings (Pessimistic scenario).
Table 10. economic losses rankings for combined infrastructure rankings (Pessimistic scenario).
Table 11. Economic loss rankings the two scenarios in thousand PHP.