Figures & data
Figure 1. Demographic profile of the study area.
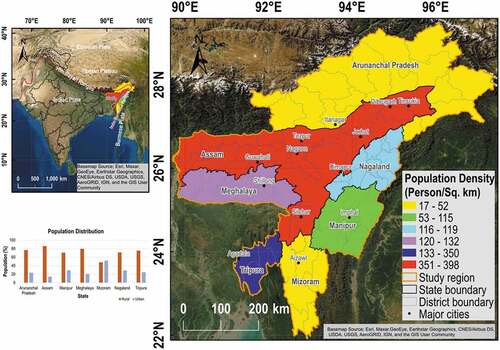
Figure 2. a) Seismotectonic map of the study area. b) Seismic source zonation of the study area showing the spatial distribution of declusterd earthquake.
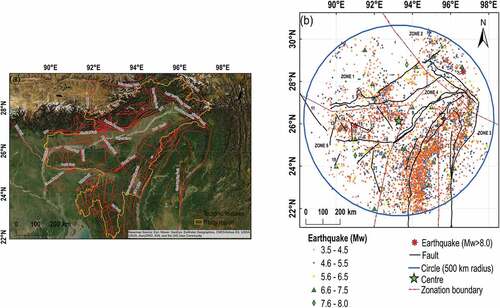
Table 1. Relation between different magnitude scales.
Figure 3. Comparison of GMPEs with the observed PGA values for a different combination of moment magnitude and hypocentral distance (km): (a) Mw 5.0, h 43, (b) Mw 5.9, h 15, (c) Mw 6.0, h 17, (d) Mw 6.0, h 34, (e) Mw 7.3, h 90.
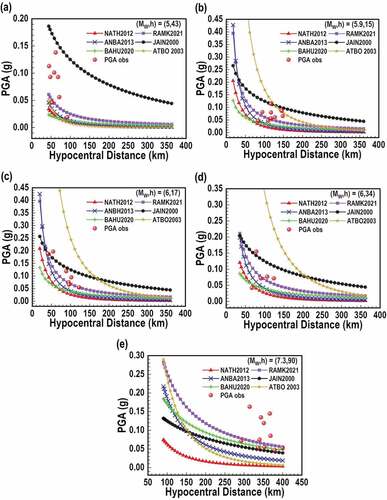
Table 2. List of selected GMPEs.
Table 3. List of common social vulnerability indicators and their variables.
Table 4. Selected variables based on PCA.
Figure 4. Seismic hazard curves (Shillong city).
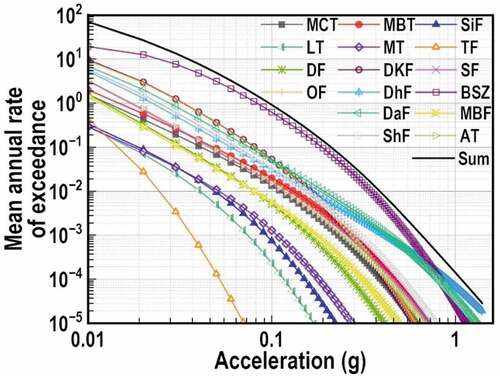
Figure 5. Scree plot.
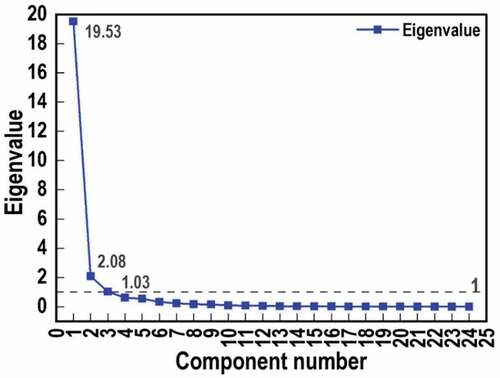
Figure 6. Risk matrix.
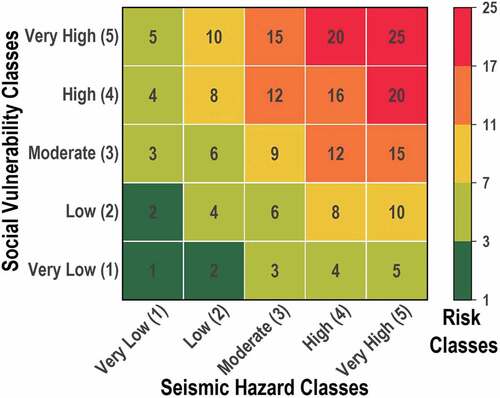
Figure 7. Spatial distribution of PGA at the bedrock level for a return period of (a) 475 years, (b) 950 years, and (c) 2475 years.
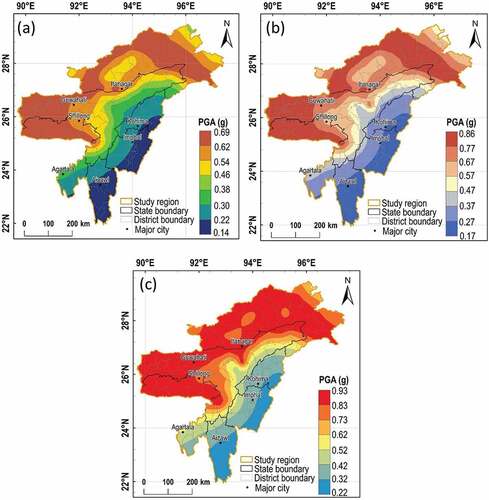
Table 5. Comparison of the estimated seismic parameters with previously reported values.
Table 6. Comparison of estimated PGA values obtained for important cities with previously reported values.
Figure 8. Spatial distribution of social factors (a) Factor 1, (b) Factor 2, (c) Factor 3 and (d) SVI.
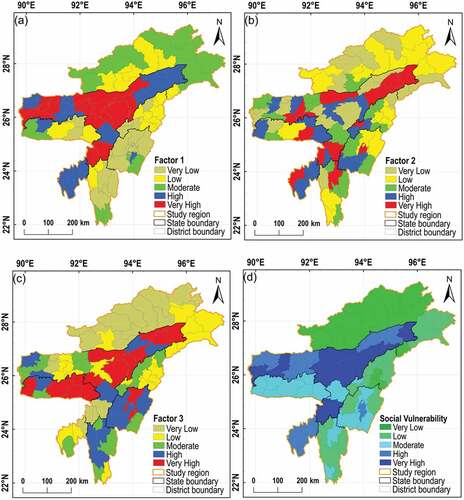
Table 7. Classification scheme of SHI, SVI, and Risk zone at a regional scale and corresponding areal distribution.
Figure 9. Spatial cluster analysis of SVI.
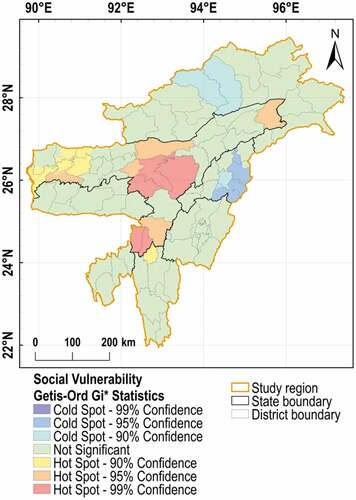
Figure 10. (a) Seismic hazard class; (b) Risk zonation.
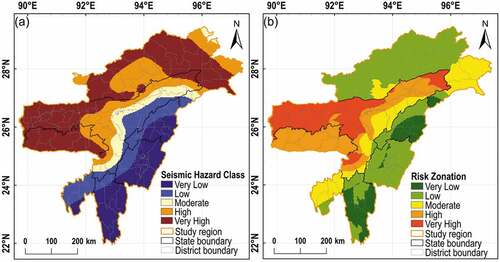
Figure 11. Comparison of areal distribution (%) of different classes of SV, SH, and Risk indexes in NER.
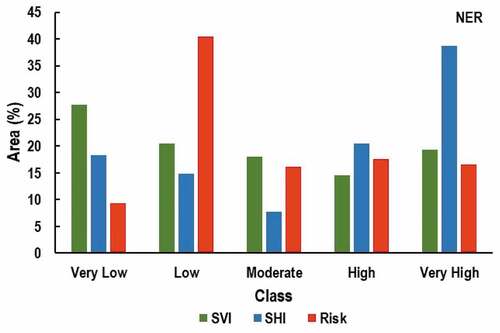
Figure 12. Seismic hazard classification map at sub-regional level.
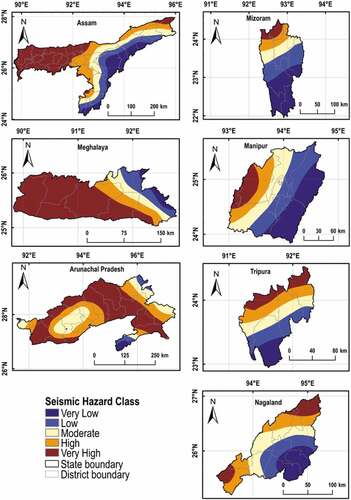
Figure 13. Comparison of areal distribution (%) of different seismic hazard classes at the sub-regional level.
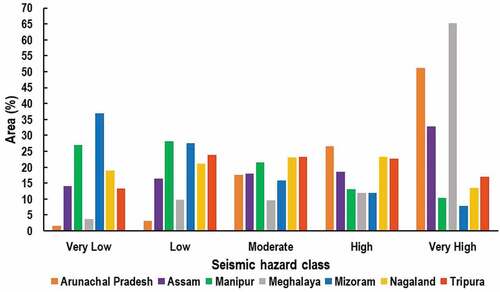
Figure 14. Distribution of SVI classes at the sub-regional level.
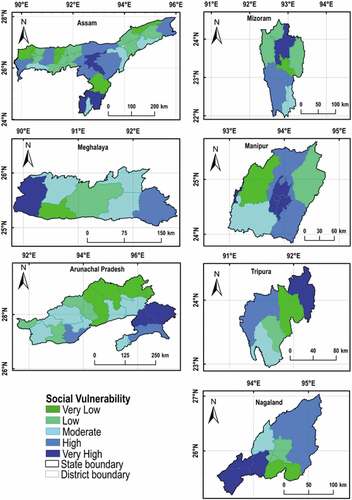
Figure 15. Comparison of areal distribution (%) of different SVI classes at the sub-regional level.
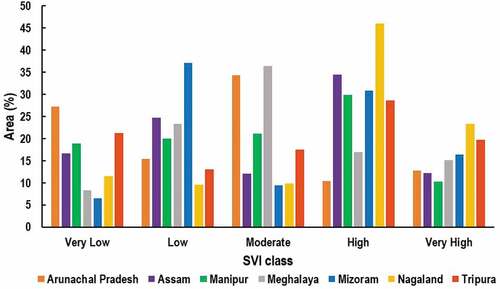
Figure 16. Risk zonation map at the sub-regional level.
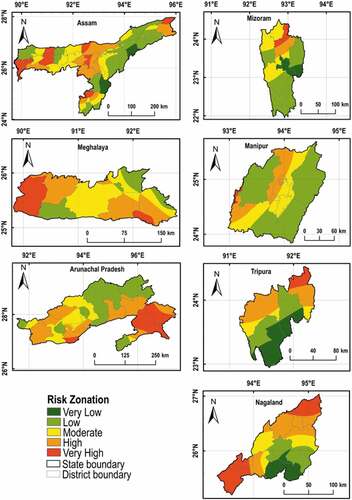
Figure 17. Comparison of areal distribution (%) of different risk classes at the sub-regional level.
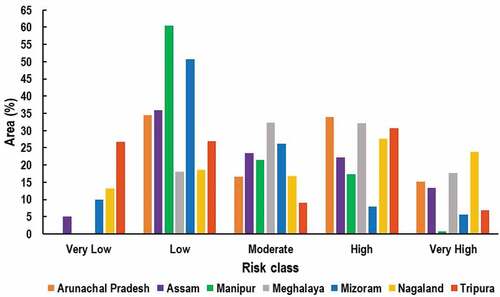
Table 8. Classification scheme of SHI, SVI, and Risk zone and corresponding areal distribution.
Figure 18. Conversion from (a) mb to Mw, (b) ML to Mw, and (c) MS to Mw.
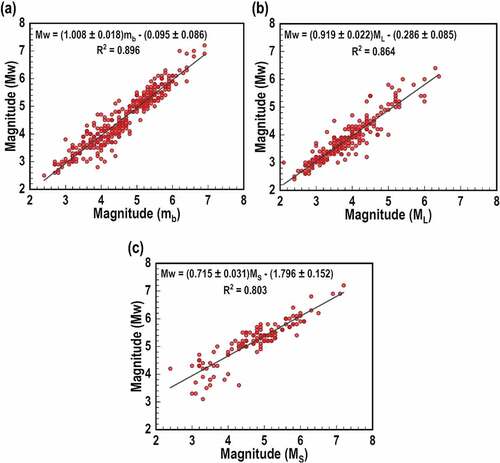
Figure 19. Completeness of the earthquake catalog with time.
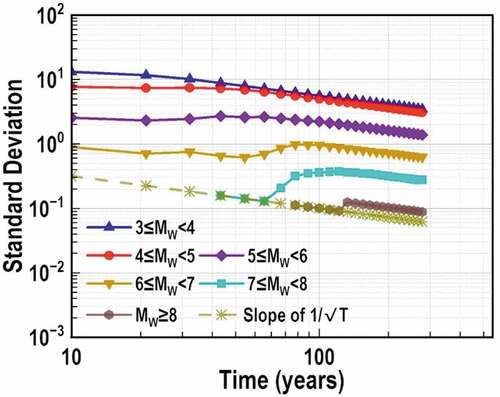
Table A1. Seismic parameters and MC values.
Figure 20. Gutenberg-Richter relation for each source zone (a) Zone 1, (b) Zone 2, (c) Zone 3, (d) Zone 4, and (e) Zone 5.
Table A2. Seismic source zone characterization of the study area.
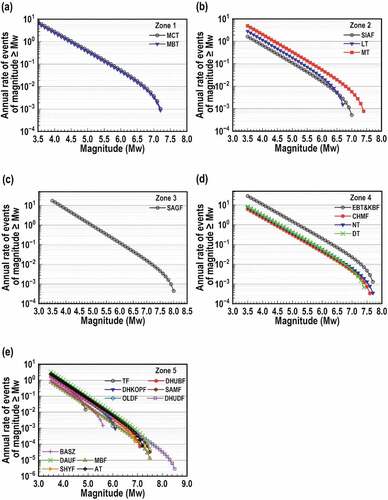
Figure 21. Fault level recurrence relation for source (a) Zone 1, (b) Zone 2, (c) Zone 3, (d) Zone 4, and (e) Zone.