
Figures & data
Table 1. Case study information.
Figure 1. Map of case studies jurisdictions and utilities.
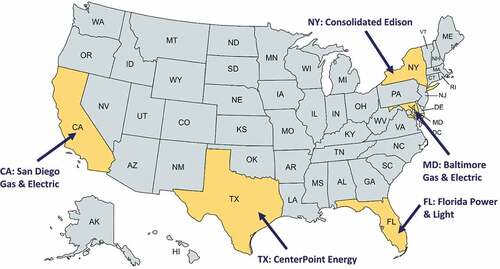
Figure 2. Hurricane Frances making landfall in Florida in 2004 (Wikimedia Commons, Citation2004).
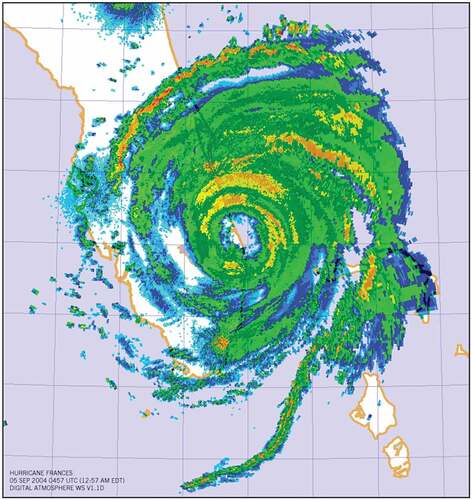
Figure 3. Tropical storm Sandy wind speed probabilities (Fairfax Office of Emergency Management, Citation2012).
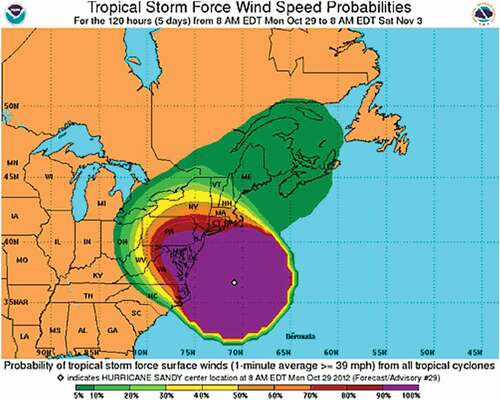
Figure 4. Distribution lines in Rockport, Texas following Hurricane Harvey (Reuters, Citation2017).
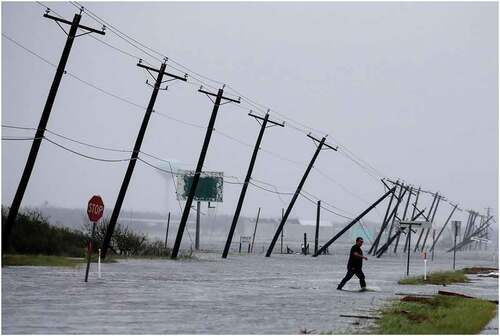
Figure 5. Example of a fire in the San Diego County wildland-urban interface (San Diego Union-Tribune, 2013).
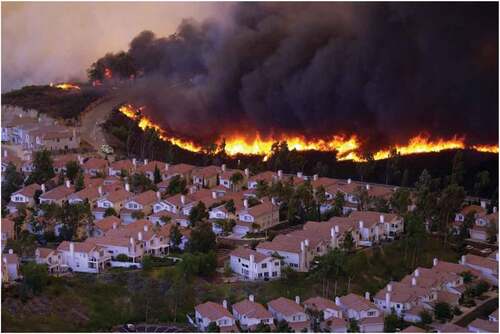
Table 2. Availability of economic information related to preventing or mitigating future power disruptions.