Figures & data
Figure 1. Storyline framework – Discrete storylines within a continuum of future system states. The grey and black line indicate possible storylines, which connect the choices in the remote climate drivers to sea level rise, the choices in infrastructure adaptation and the choices in infrastructure expansion. Individual choices can be made with regards to adaptation and expansion for different infrastructure types.
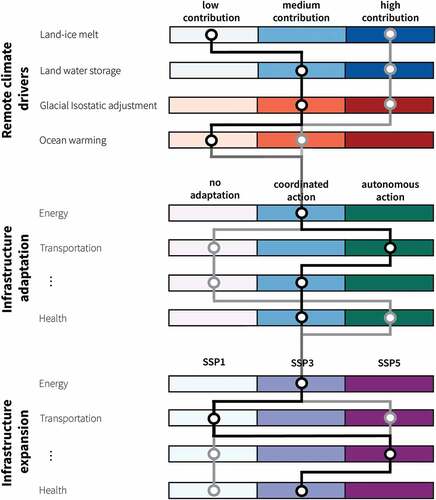
Table 1. Summary of the sea level scenario choices.
Figure 2. Map of sea level change in 2120–2125 compared to 1986–2005 for the medium scenario (left). Time series of the three sea level scenarios in the Northern German coast for the Xaver storm.
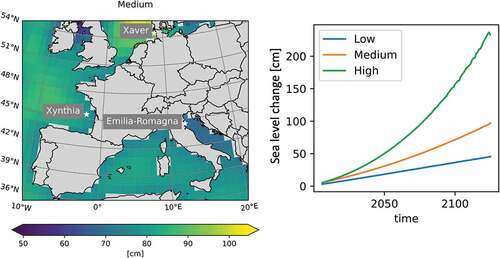
Table 2. Sea level rise in cm between the date of the storms and 2120 for the three climate scenarios.
Figure 3. Left panel: Coastline section where storm Xynthia made landfall. In red, the area where the seawall collapse is simulated. The yellow line indicates the coastline. Flooded areas are indicated in shades of blue, according to the water depth. Right panel: The spatial distribution of locations that suffer damages to CI along the coastline of Western France.
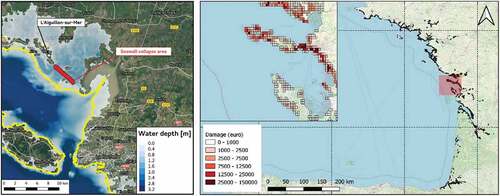
Figure 4. Total coastal flood damage estimates for storm Xynthia under three socioeconomic infrastructure expansion scenarios (the three panels), three climate change scenarios (the grouped bars) and three adaptation measures (the colours). The dotted line indicates the simulated damage for the reference event.
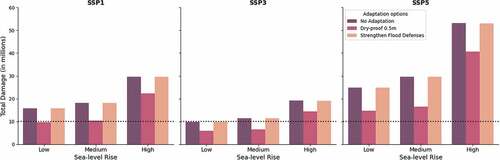
Figure 5. Left panel: Coastline section where storm Xaver made landfall. In red, the area where the seawall is present in the simulation. The yellow line indicates the coastline. Flooded areas are indicated in shades of blue, according to the water depth. Right panel: The spatial distribution of locations that suffer damages to CI along the coastline of Germany.
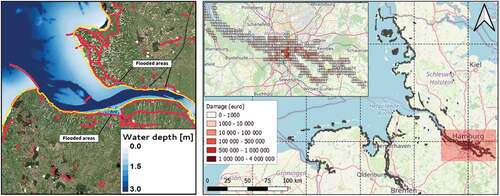
Figure 6. Total coastal flood damage estimates for storm Xaver under three socioeconomic infrastructure expansion scenarios (the three panels), three climate change scenarios (the grouped bars) and three adaptation measures (the colours). The dotted line represents the simulated historic event.

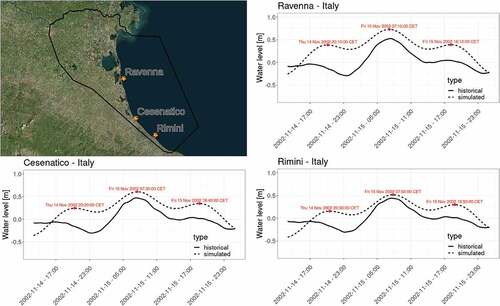
Figure 7. Left panel: The storm surge event of 15 November 2002, as simulated by ANUGA when the storm surge hits the city of Rimini. In red, the area where the coastal defence project called ‘Parco del Mare’ is located. The yellow line indicates the coastline. Flooded areas are indicated in shades of blue, according to the water depth. Right panel: The spatial distribution of locations that suffer damages to CI along the coastline of the Emilia-Romagna region.
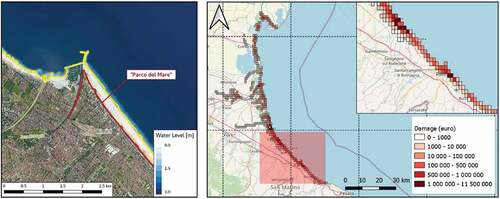
Figure 8. Total coastal flood damage estimates for the storm surge event in Emilia Romagna under three socioeconomic infrastructure expansion scenarios (the three panels), three climate change scenarios (the grouped bars) and three adaptation measures (the colours). The dotted line represents the simulated historic event.
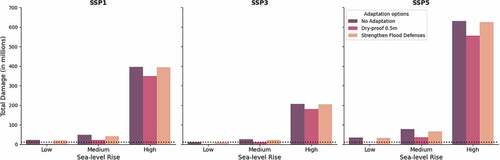
Figure A1. Storm Xynthia (2010). Water levels from ERA5-reanalysis and ANUGA simulations.
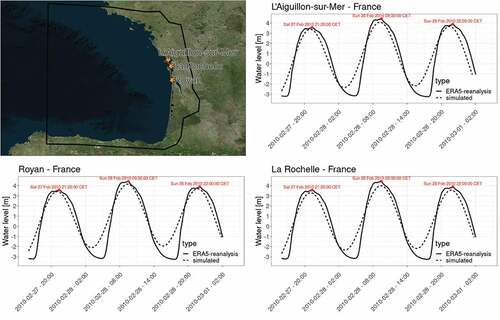
Figure A2. Storm Xaver (2013). Water levels from ERA5-reanalysis and ANUGA simulations.
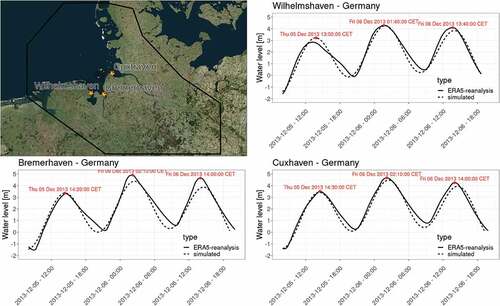
Figure A3. Storm surge in Emilia-Romagna (2002). Water levels from historical observations and ANUGA simulations.