
Figures & data
Figure 1. Proposed framework for WWTP’s flood resilience improvement by financial allocation and prioritized asset restoration.
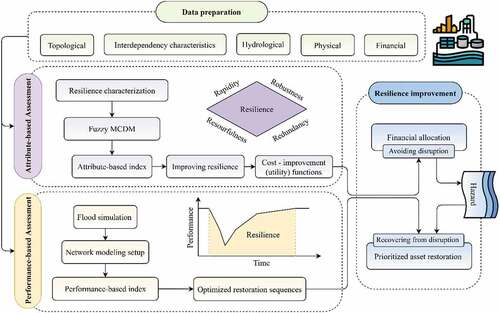
Figure 2. Sub-criteria defined for quantifying WWTPs’ flood resilience (Adapted from Karamouz & Hojjat-Ansari, Citation2020).
Table 1. 9-level fuzzy scale for the pairwise relative importance.
Table 2. Economic sub-criteria with their corresponding marginal costs in USD. (Adapted from Karamouz & Hojjat-Ansari, Citation2020).
Figure 3. An example network before and after the failure of one of its nodes.
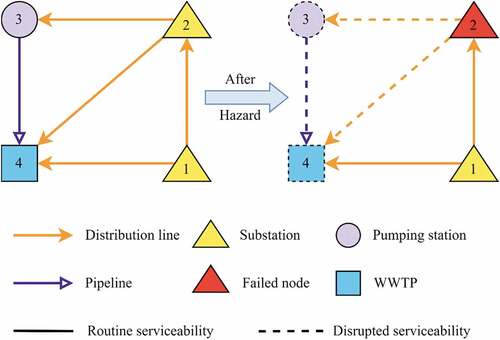
Figure 4. Post-disaster behavior and the system’s recovery curve. (Adapted from Bristow, Citation2015).
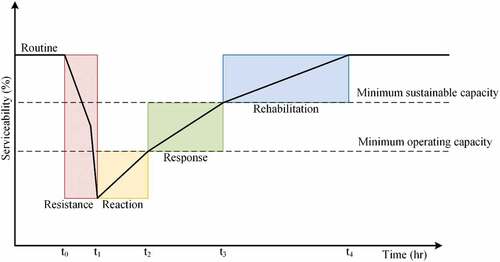
Figure 5. Classification of INM components according to their score.
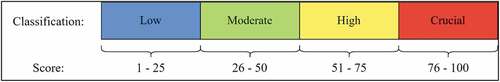
Table 3. Specifications of the WWTPs in the study area (Retrieved from NYCDEP (New York City Department of Environmental Protection), Citation2013).
Table 4. Values of sub-criteria for WWTPs in the study area.
Figure 6. The study area with its wastewater infrastructure and its related power facilities.
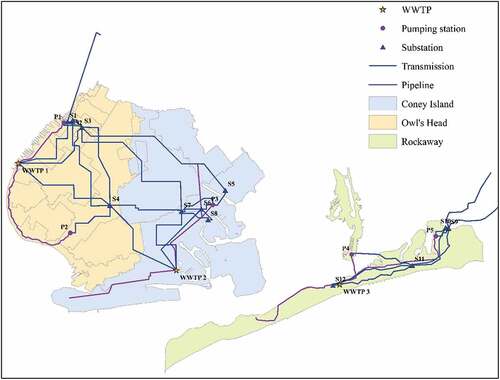
Table 5. Hydrological and technical data sources used in the study.
Table 6. Sources used for determining the failure probability and recovery coefficients of different INM components.
Figure 7. For a typical electrical substation: a) Fragility curve, b) water depth versus damage, and c) repair time versus damage (From Sánchez-Muñoz et al., Citation2020).
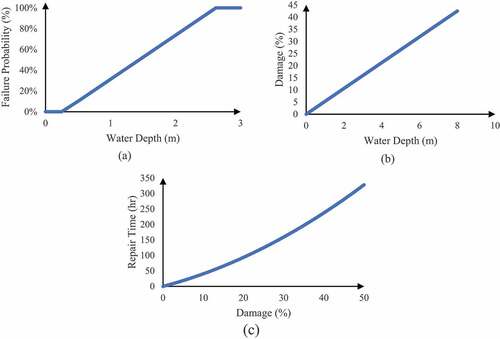
Table 7. Estimated fuzzy and crisp weights calculated for the sub-criteria.
Figure 8. Fuzzy and crisp resilience metrics obtained for the WWTPs in the study area.
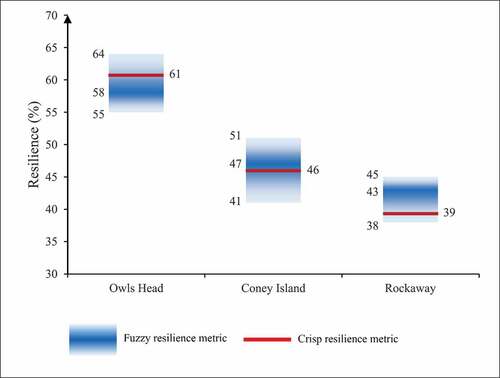
Figure 9. Fuzzy and crisp UFs for the three WWTPs of Owls Head (a), Coney Island (b), and Rockaway (c).
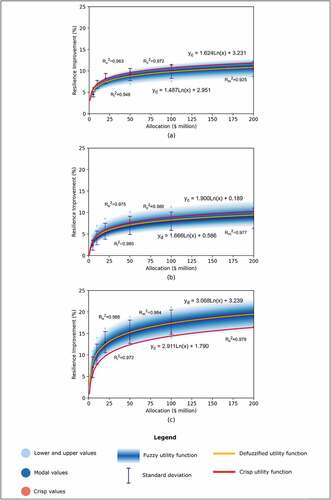
Figure 10. Final financial allocations and their corresponding potential resilience improvement.
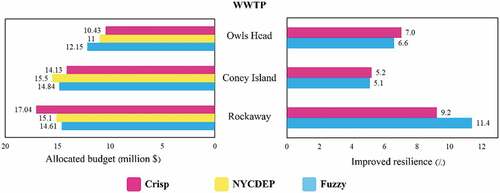
Figure 11. The simulated inundation map of the study area obtained from hydrological modeling.
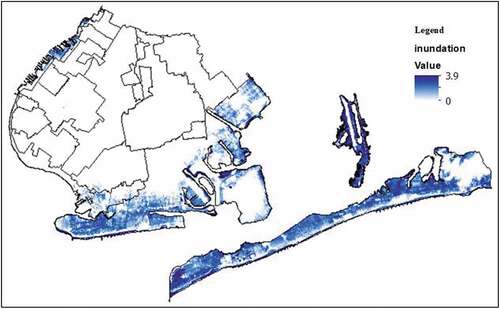
Table 8. Maximum inundation depth at network nodes under simulated Sandy Superstorm.
Figure 12. The INM of the study area developed in MATLAB.
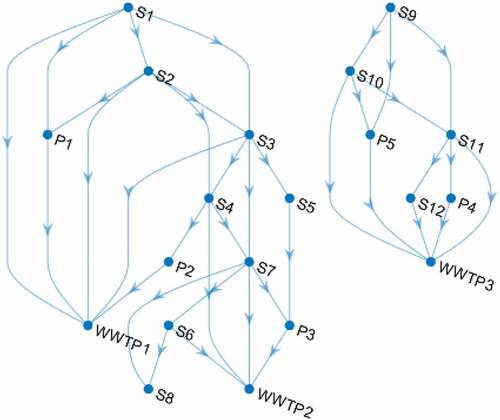
Figure 13. The recovery curves and their corresponded resilience metrics obtained from the INM before and after the optimization.
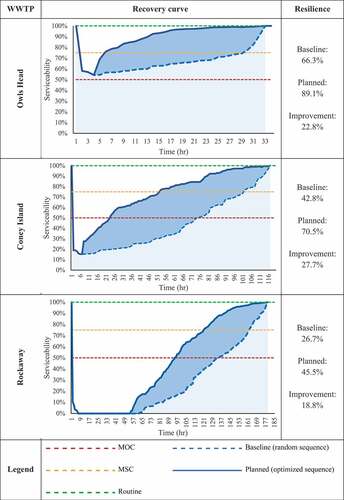
Figure 14. Prioritized network components for restoration in the study area.
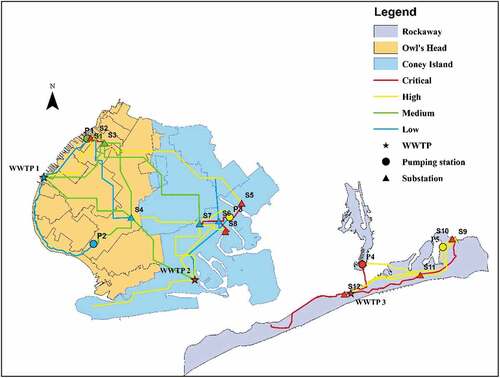
Table A1. Descriptions of sub-criteria.