
Figures & data
Table 1. Benefit categories, corresponding variables and data sources, applicability to green or grey infrastructure, and location priorities indicating whether being within a high or low risk zone or being close or far from the variable’s spatial locations is prioritized for an infrastructure solution.
Figure 1. Flowchart of the proposed spatial mapping methodology.
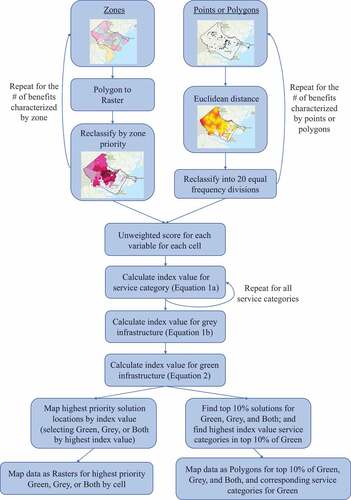
Figure 2. Study location of Chatham County, GA, USA: (a) Chatham County is highlighted on the coast of the state of Georgia. (b) Outline of study area of Chatham County, excluding undeveloped coastal marshes (speckled regions).
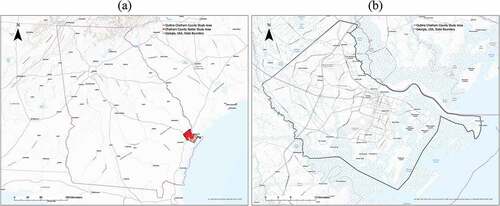
Figure 3. Resulting map for Person A: (a) Gradient of location indices for selection of green, grey, or both infrastructure placement. (b) The top 10% of infrastructure index locations and the service categories that should be prioritized in selecting an infrastructure solution.
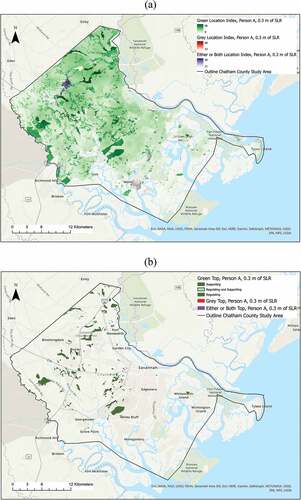
Figure 4. Resulting map for Person B: (a) Gradient of location indices for selection of green, grey, or both infrastructure placement. (b) The top 10% of infrastructure index locations and the service categories that should be prioritized in selecting an infrastructure solution.
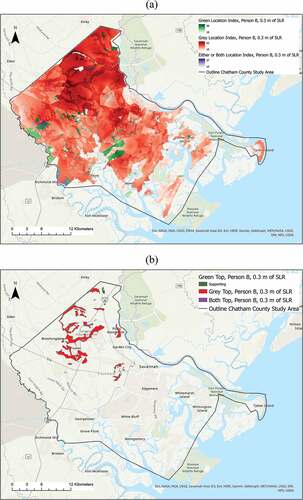
Figure 5. Resulting map for Person C: (a) Gradient of location indices for selection of green, grey, or both infrastructure placement. (b) The top 10% of infrastructure index locations and the service categories that should be prioritized in selecting an infrastructure solution.
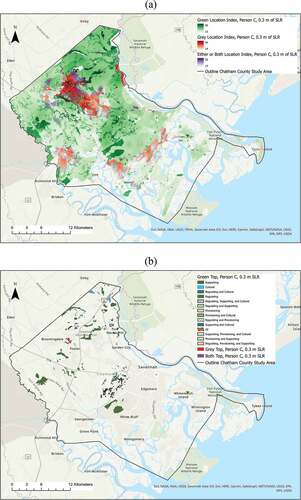
Figure 6. Gradient of location indices for selection of green, grey, or both infrastructure placement under 0.3 m SLR (a) for an unweighted scenario and (b) using average ratings across stakeholder responses. The top 10% of infrastructure index locations and the service categories that should be prioritized in selecting an infrastructure solution (c) for an unweighted scenario and (d) using average ratings across stakeholder responses.
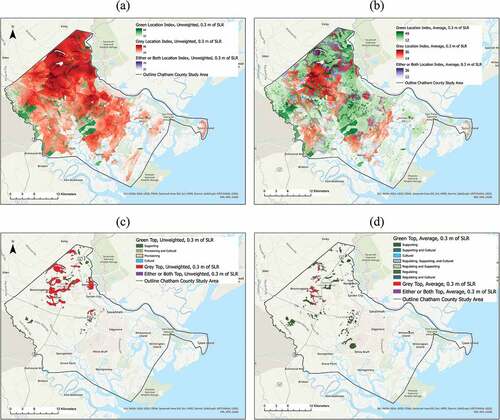
Figure 7. Gradient of location indices for selection of green, grey, or both infrastructure placement under 1.2 m SLR (a) for an unweighted scenario and (b) using average ratings across stakeholder responses. The top 10% of infrastructure index locations and the service categories that should be prioritized in selecting an infrastructure solution (c) for an unweighted scenario and (d) using average ratings across stakeholder responses.
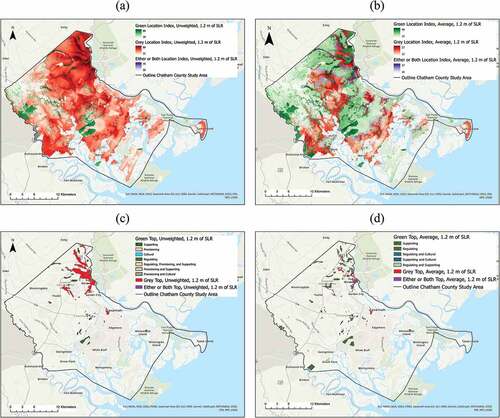
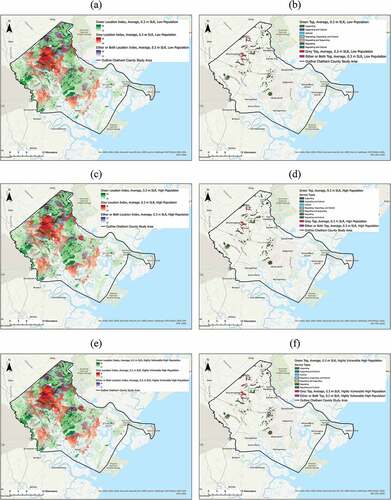
Figure 8. Gradient of location indices for selection of green, grey, or both infrastructure placement under 0.3 m SLR in an unweighted analysis with (a) low population estimates, (c) high population estimates, and (e) high population estimates for more vulnerable census tracts. Top 10% of infrastructure index locations and the service categories that should be prioritized in selecting an infrastructure solution with (b) low population estimates, (d) high population estimates, and (f) high population estimates for more vulnerable census tracts.
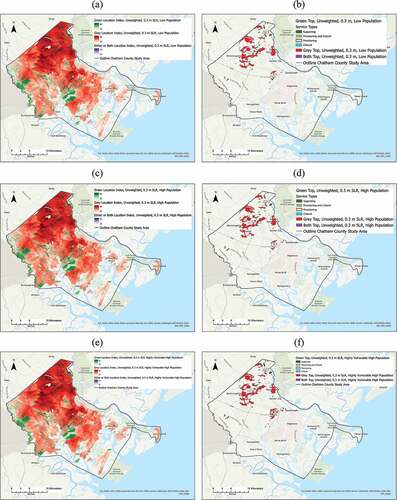
Figure 9. Gradient of location indices for selection of green, grey, or both infrastructure placement under 0.3 m SLR for the average stakeholder ratings analysis with (a) low population estimates, (c) high population estimates, and (e) high population estimates for more vulnerable census tracts. Top 10% of infrastructure index locations and the service categories that should be prioritized in selecting an infrastructure solution with (b) low population estimates, (d) high population estimates, and (f) high population estimates for more vulnerable census tracts.
Data Availability Statement
The data and codes used during this study are available from the corresponding author by reasonable request.