Figures & data
Figure 1. The step-by-step graphical framework of the current study.
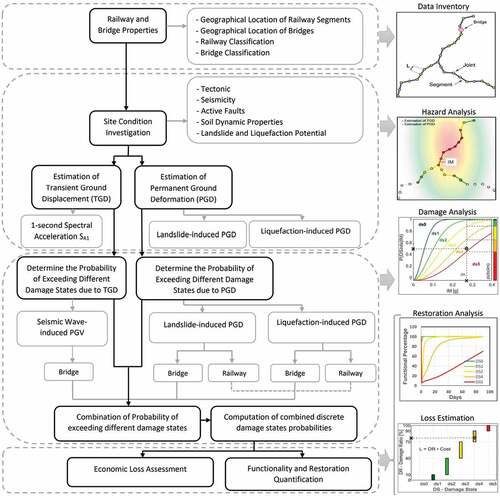
Figure 2. The physical network of Iran railway network (The Railways of Islamic Republic of Iran, 2005).
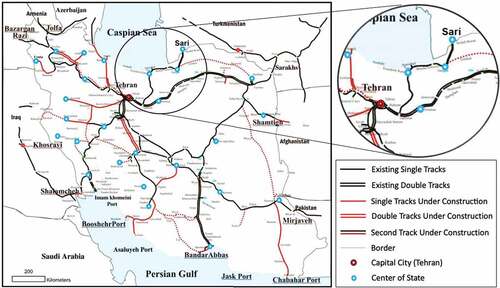
Figure 3. Satellite and aerial picture of the Tehran-Sari railway.
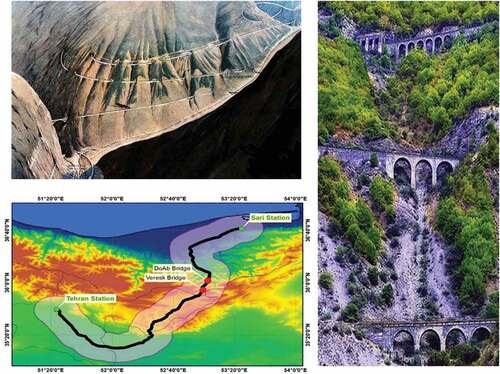
Table 1. The Tehran-Sari railway properties.
Figure 4. Left: DoAb Bridge; Right: Veresk Bridge. both bridges are located on the map in .
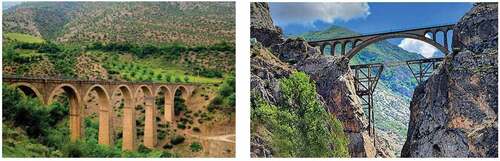
Table 2. The Tehran-Sari railway properties of the two studied bridges (Ahamri et al., Citation2016).
Figure 5. Seismic area sources of studied region using available data (Karimiparidari, Citation2014).
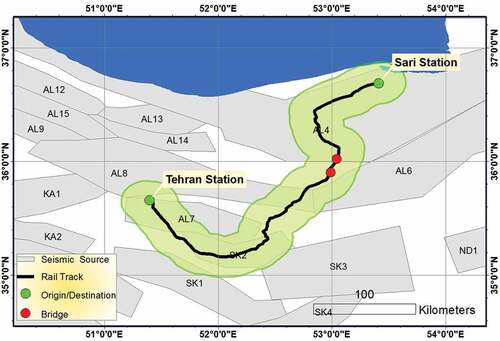
Table 3. Seismic parameters of the employed seismic sources in the current study (Karimiparidari, Citation2014).
Figure 6. The final seismic hazard map analyzed using R-CRISIS.
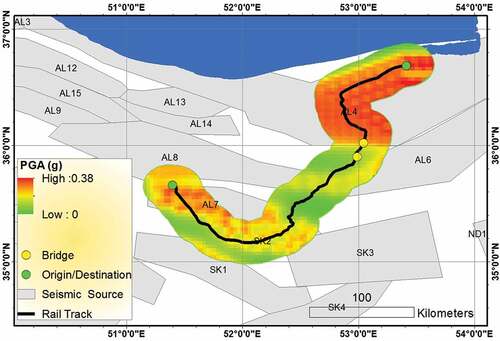
Table 4. The applied attenuation models and assigned weights.
Table 5. Summary of the attenuation models used in this study.
Figure 7. Liquefaction susceptibility map of the current studied region (Komakpanah & Farajzadeh, Citation1996).
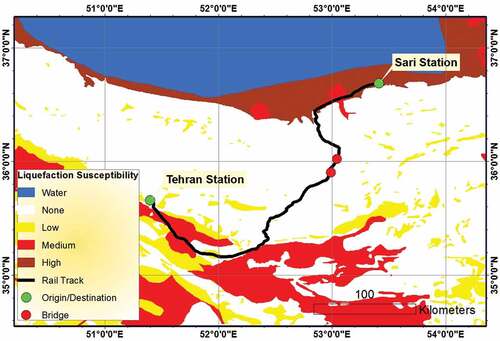
Figure 8. Liquefaction-induced deformation map of the Tehran-Sari railway and two mentioned bridges (30 m DEM is used).
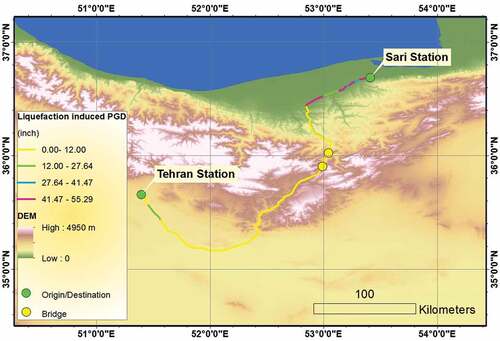
Figure 9. Landslide susceptibility map of the current studied region (Geological Survey of Iran, 2001).
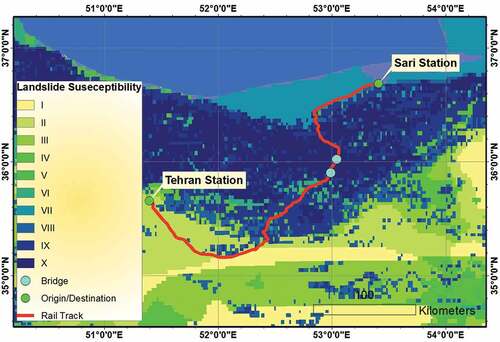
Figure 10. Landslide-induced displacement map of the Tehran-Sari railway, and Veresk and DoAb bridges.
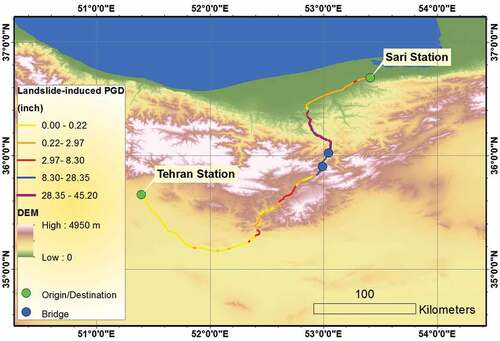
Figure 11. Fragility curves of railway tracks (FEMA, Citation2012).
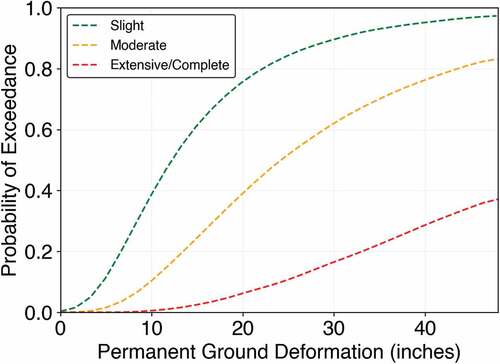
Figure 12. Ground shaking standard fragility curves for conventionally designed major bridges (FEMA, Citation2012).
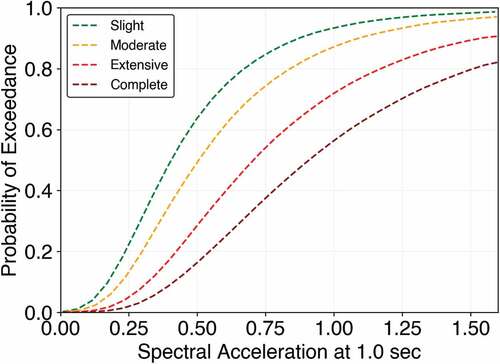
Table 6. Damage state definition of railway tracks (FEMA, Citation2012).
Table 7. Damage states definition of railway bridges (FEMA, Citation2012).
Table 8. Standard fragility curves properties of railway tracks (FEMA, Citation2012).
Table 9. Standard fragility curves properties of railway bridges (FEMA, Citation2012).
Table 10. Modified properties used in fragility analyses of bridges.
Table 11. Intensity measures used for bridges risk assessment (obtained from seismic hazard analysis results).
Table 12. Estimated shake-only, PGD-only and combined probability of exceeding of various damage states for bridge components of Tehran-Sari railway network.
Figure 13. Expected damage state map for the Tehran-Sari railway. The figure shows extensive damages are expected mostly in plain sector where the probability of liquefaction and the shake intensity measure are high.
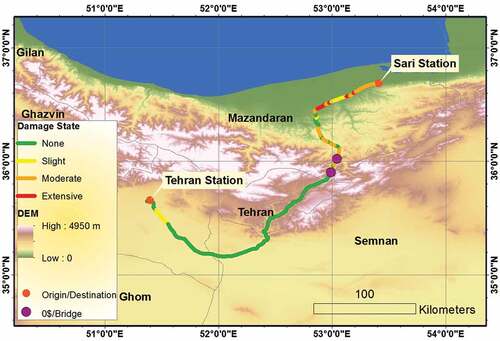
Table 13. Combined exceeding probability of various damage states obtained from estimated damage probabilities subject to shaking, liquefaction and landslide.
Figure 14. Functionality percentage of the railway tracks obtained based on HAZUS discrete restoration functions. The reported minimum and maximum values show the lowest and highest functionality for various segments and the mean value reports the functionality of the entire railway track.
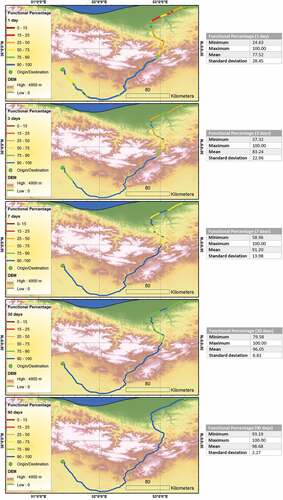
Figure 15. System level restoration curve for Tehran-Sari railway network providing functionality percentage of the systems days following a design basis earthquake scenario.
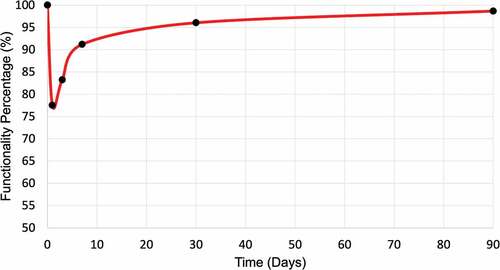
Table 14. Discrete restoration curves used for functionality analysis 1 day, 3 days, 7 days, 30 days and 90 days following seismic event (FEMA, Citation2012).
Figure 16. Estimated economic loss map for the Tehran-Sari railway.
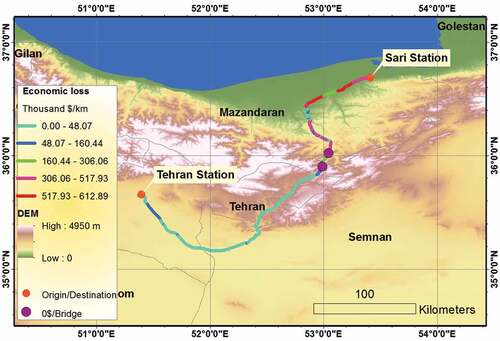
Table 15. Damage ratios and replacement values for railway track and railway bridge (FEMA, Citation2012).
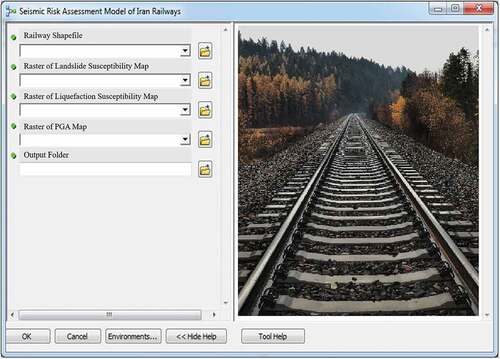
Figure A17. User interface of the seismic risk assessment model of Iran railway tracks.
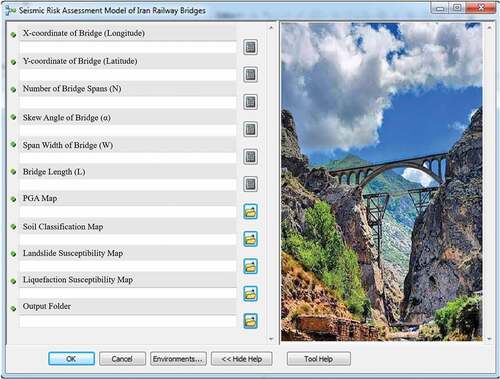
Figure A18. User interface of the seismic risk assessment model of Iran railway bridges.