Figures & data
Figure 1. Flowchart of computations in TransChlor®.
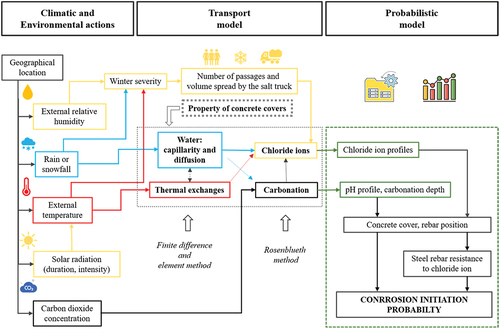
Figure 2. Definition of durability condition states.
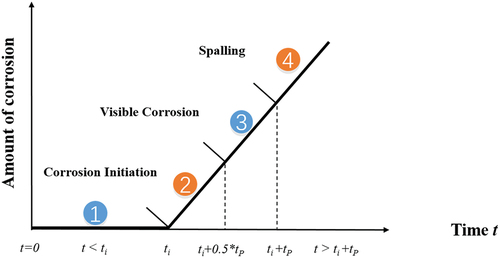
Table 1. Variables of the propagation model.
Figure 3. Reproduction operation: (a) crossover and (b) mutation operations.
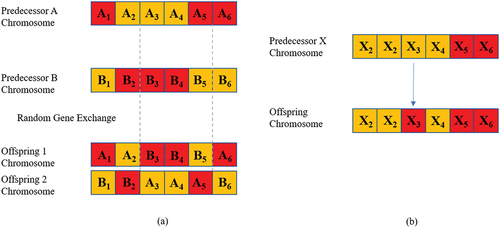
Table 2. Yearly Transition Probability Matrices (at the time of actions).
Table 3. Quality Classes of Cover Concrete for non-saturated concrete (Proceq, Citation2005).
Table 4. Cost matrix of M&R strategies ($/m2).
Table 5. Yearly Transition Probability Matrices for three climate scenarios (Historical, RCP4.5 and RCP8.5) and concrete cover thickness (5 mm, 0 mm, and 0 mm).
Figure 4. An overview of the proposed framework.
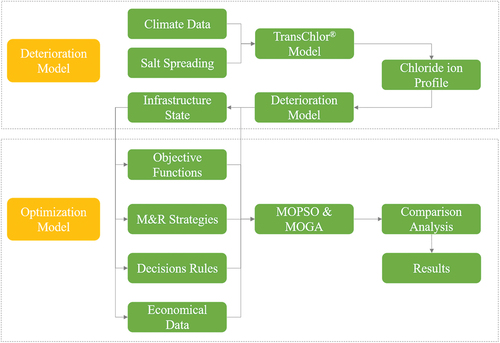
Figure 5. Locations of field tests performed on the bridge.
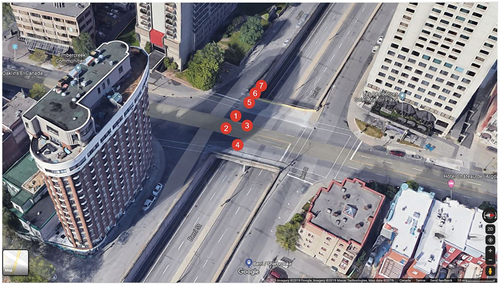
Figure 6. Nomogram for determining the quality classes of concrete as a function of air permeability and resistivity (test results are shown as red dots) (Proceq, Citation2005).
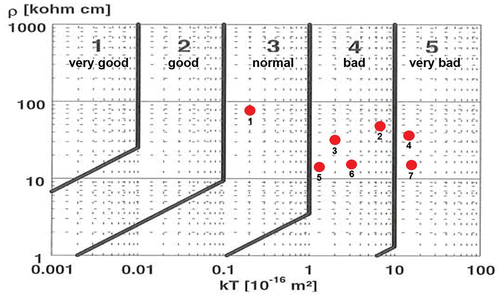
Figure 7. Total yearly number of winter precipitation days (daily precipitation > 0.1 mm). Historical Records and projections from RCP8.5 and RCP4.5.
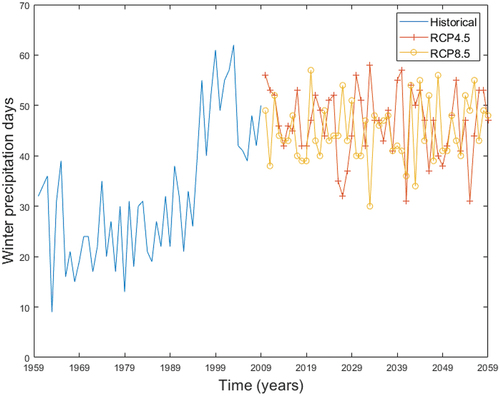
Figure 8. Condition state probabilities as a function of time (year) for three climate scenarios (Historical, RCP4.5 and RCP8.5) and concrete cover thickness (25 mm, 50 mm and 70 mm).
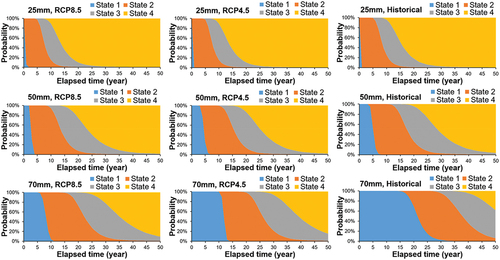
Figure 9. Best solutions for three climate scenario and a concrete cover thickness of 25 mm.
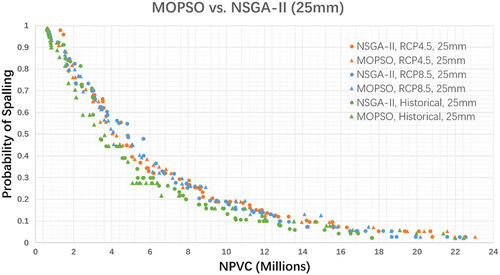
Figure 10. (A) Best solutions for three climate scenarios and a concrete cover thickness of 50 mm; (b) Comparison of Maintenance Plan for the considered optimization techniques.
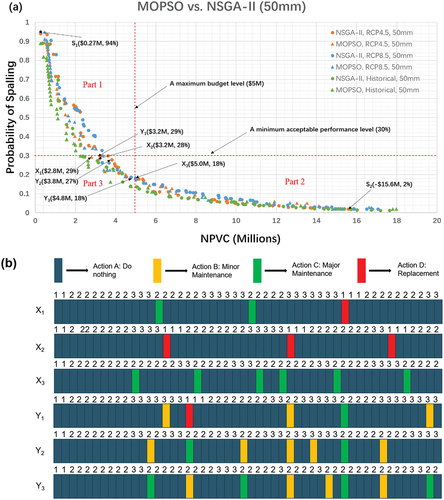
Figure 11. Best solutions for three climate scenario and a concrete cover thickness of 70 mm.
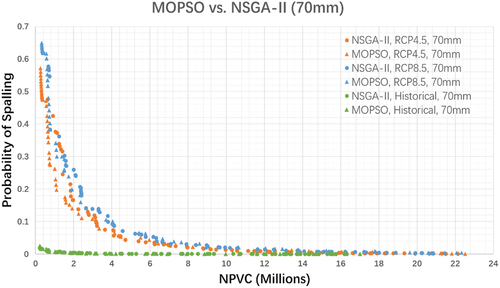
Figure 12. Best solutions for three concrete cover thickness for the RCP8.5 climate change scenario.
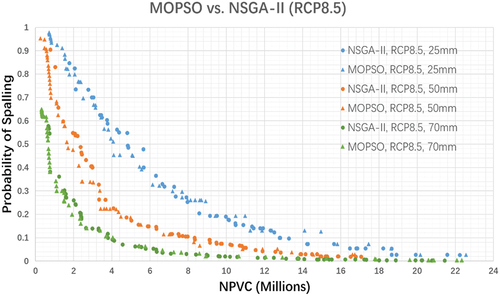
Figure 13. Best solutions for three concrete cover thickness for the RCP4.5 climate change scenario.
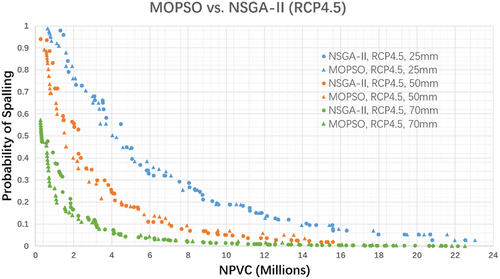
Figure 14. Best solutions for three concrete cover thickness for the Historical climate change scenario.
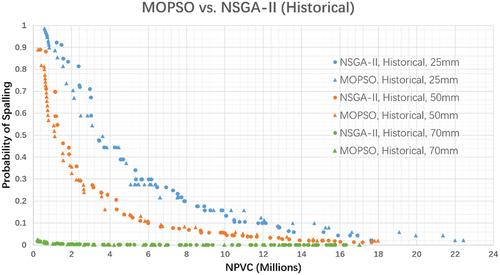
Figure 15. Optimized deterioration pattern for the six representative M&R actions of the bridge deck showing different action spread and level throughout the bridge lifetime. (a) two major maintenances and one replacement (X1); (b) three replacements (X2); (c) six major repairs (X3); (d) three minor maintenances, one major maintenance and one replacement (Y1); (e) five minor maintenances and two major maintenances (Y2); (f) four minor maintenances and four major maintenances.
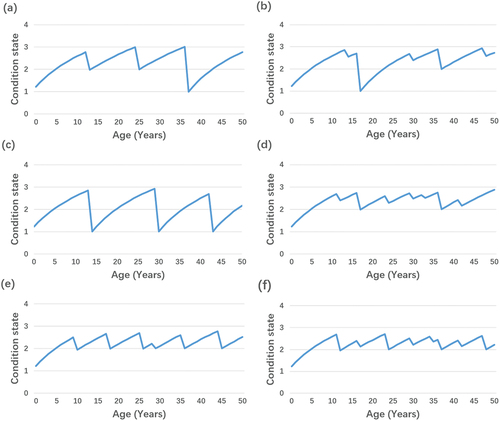
Figure 16. Number of M&R actions as a function of Probability of Spalling for two optimization methods. (a) MOPSO, RCP4.5, 50 mm; (b) NSGA-II, RCP4.5, 50 mm.
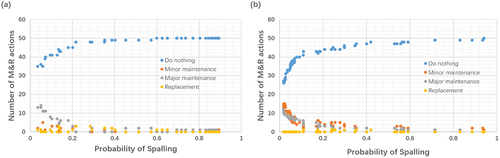
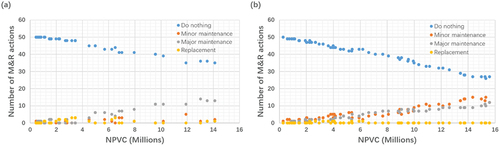
Figure 17. Number of M&R actions as a function of NPVC for two optimization methods (a) MOPSO, RCP4.5, 50 mm; (b) NSGA-II, RCP4.5, 50 mm.