
Figures & data
Figure 1. Schematic concept of community-level energy system and examples of energy provision technologies.
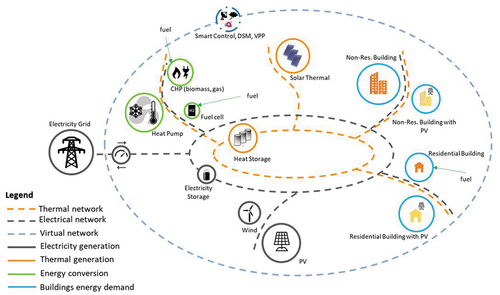
Figure 2. Flowchart of the EMP model algorithm.
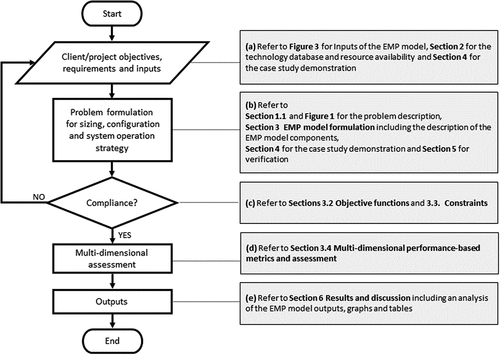
Figure 3. EMP model structure.
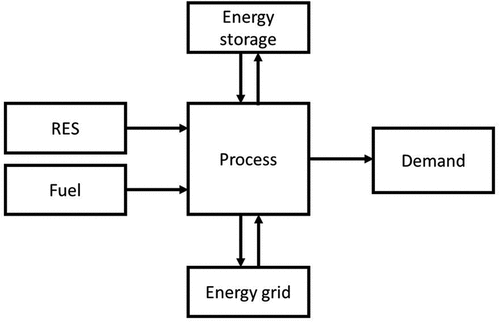
Figure 4. Inputs and outputs of the EMP model.
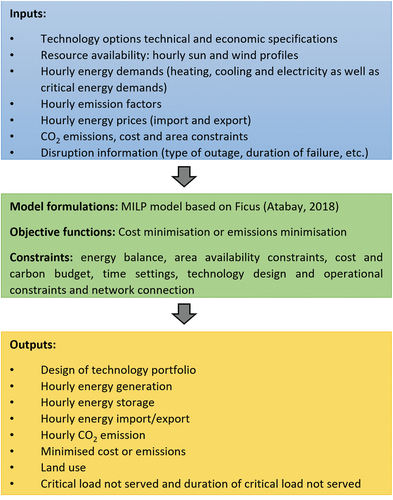
Table 1. Description of model sets.
Table 2. Selected indicators under the three (Level 1) dimensions or bottom lines considered in the EMP model.
Table 3. Energy resilience input parameters description.
Figure 5. Energy resilience module workflow based on (Charani Shandiz, Foliente, Rismanchi, et al., Citation2020).
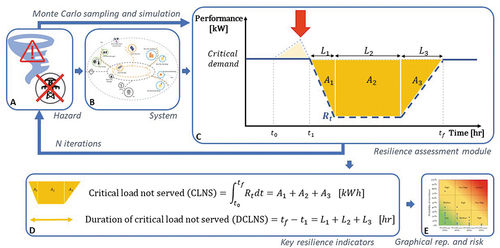
Figure 6. An artist’s impression of the new University of Melbourne campus in Fishermans Bend, Melbourne (the University of Melbourne, Citation2021).
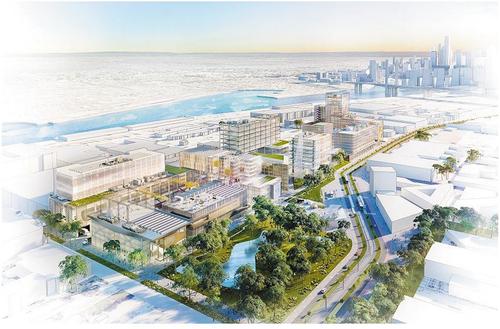
Table 4. Summary of Fishermans Bend campus energy demand.
Table 5. Wind turbine specifications.
Table 6. Input variable values for the selected case study.
Figure 7. Failure duration distribution.
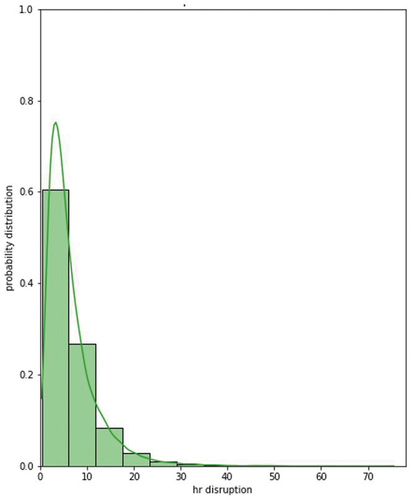
Figure 8. Hourly electricity supply and demand for one selected week in March (hours 1640 to 1808).
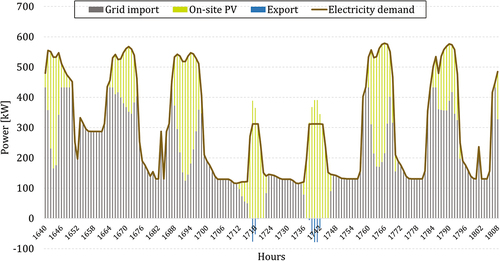
Figure 9. Hourly cooling supply and demand for one selected week in March (hours 1640 to 1808).
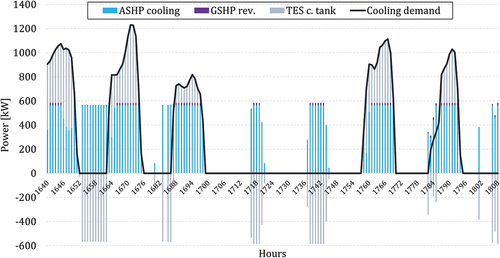
Figure 10. Hourly performance of TES c. tank for one selected week in March (hours 1640 to 1808).
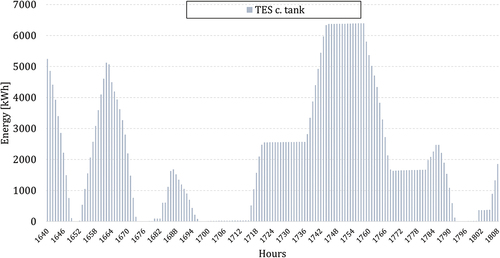
Figure 11. Hourly heating supply and demand for one selected week in March (hours 1640 to 1808).
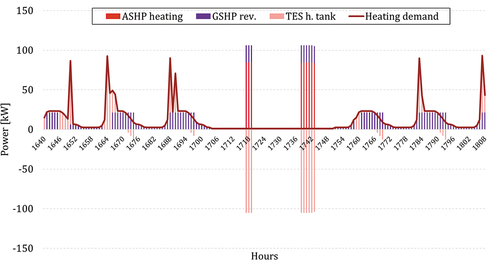
Figure 12. Hourly performance of TES h. tank for one selected week in March (hours 1640 to 1808).
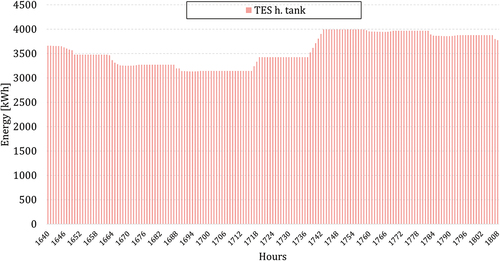
Figure 13. Annualised cost breakdown of reference community and net-zero emissions community cases.
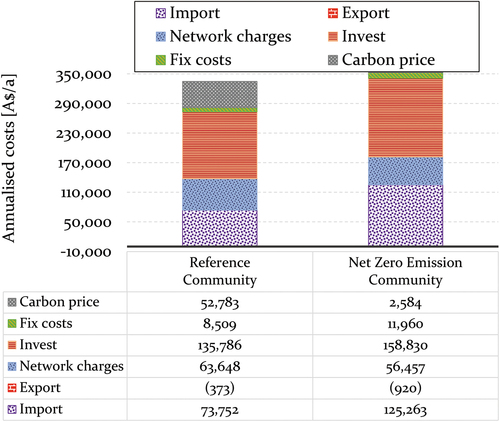
Table 7. Design capacity of technology portfolio for reference case and net-zero emissions case.
Table 8. Energy storage portfolio for reference and net-zero cases.
Figure 14. Probability and distribution of critical load not served (CLNS), kWh (left) and duration of critical load not served (DCLNS), hr (right) – reference case, start time 169h.
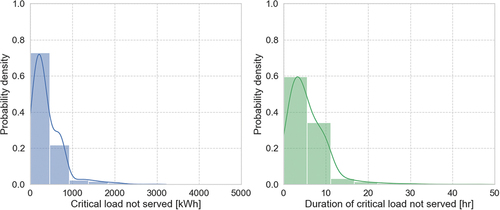
Figure 15. Cumulative probability density of critical load not served (CLNS), kWh (left) and duration of critical load not served (DCLNS), hr (right) – reference case, start time 169h.
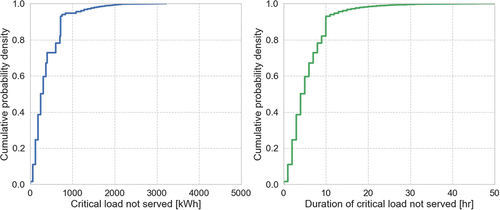
Figure 16. Two-dimensional square failure probability density distribution of the reference case (left) and the net-zero emissions case (right) for the Fishermans Bend campus case study.
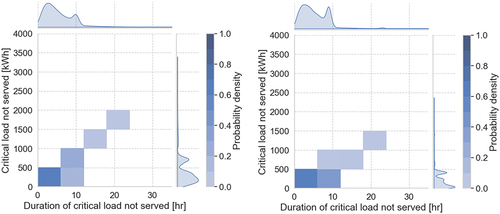
Table B1. Techno-economic database of energy generation technologies at the community level.
Table B2. Techno-economic database of energy storage technologies at the community level.
Table B3. Technical specifications of the energy storage technologies.