
Figures & data
Figure 1. Location of the Acari River Basin, along with slums, protected areas and main watercourses of the region.
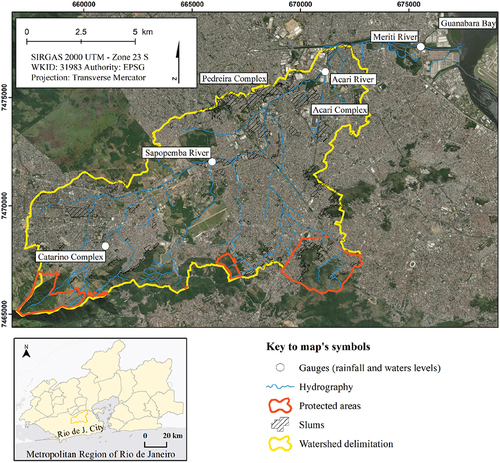
Figure 2. Photographs show the current state of degradation of rivers.
Source: Google StreetView (2021).
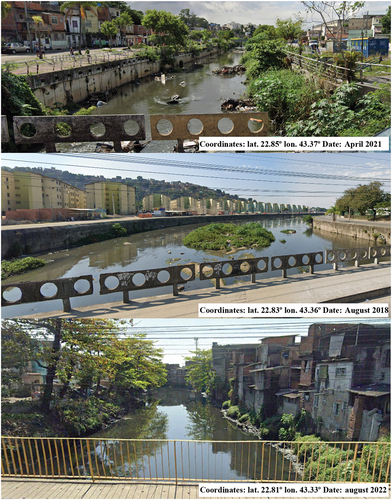
Figure 3. General steps of the proposed framework.
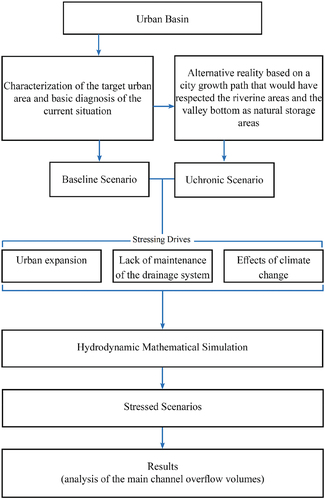
Figure 4. Proposed simulation scenarios.
Figure 5. Results of the calibration process on the river gauges.
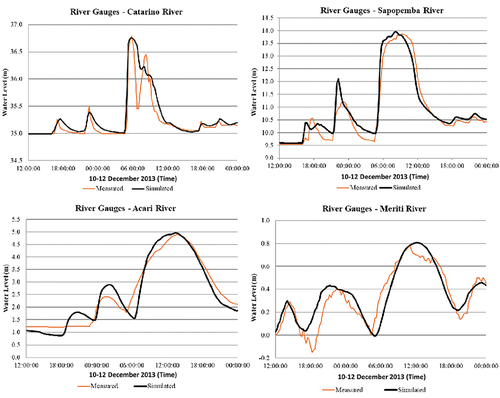
Table 1. Manning coefficient base values and adjustments based on the channel condition.
Figure 6. Flood maps obtained for each of the considered scenarios.
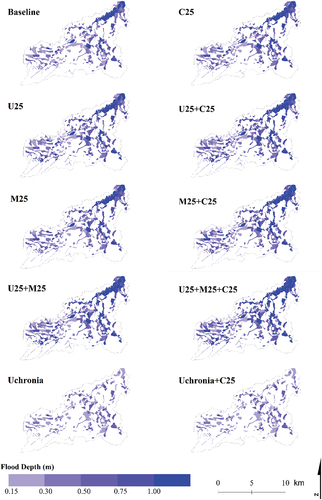
Figure 7. Overflow volumes of each scenario considered.
Data availability statement
The data that support the findings of the study are available from the corresponding author, Antonio Krishnamurti Beleño de Oliveira, upon reasonable request.