
Figures & data
Figure 1. Variation of system functionality before, during and after a disaster (Joo & Sinha, Citation2022b).
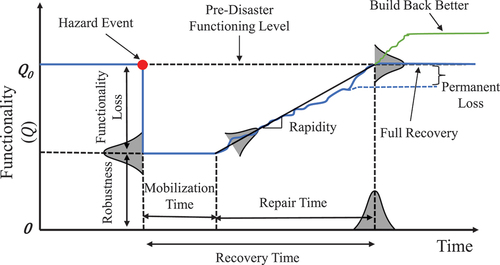
Figure 2. Plan view of an archetypical reinforced concrete frame building (ID-2215) (Badal, Citation2020).
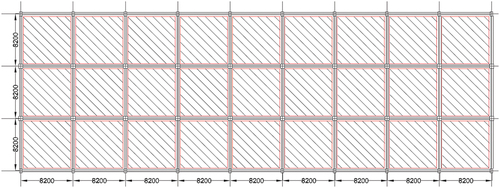
Figure 3. Illustration of performance and recovery assessment methodology.
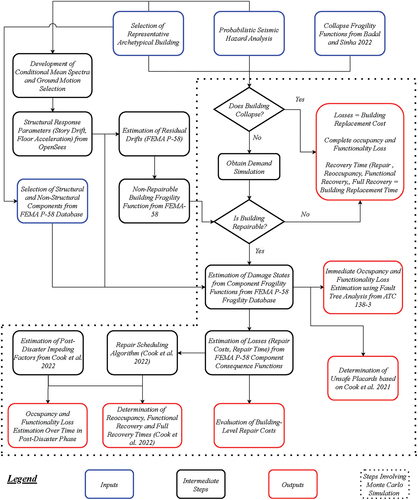
Figure 4. Ground motion selection for (a) Design basis earthquake (DBE) and (b) Maximum considered earthquake (MCE) against corresponding conditional mean spectra (CMS).
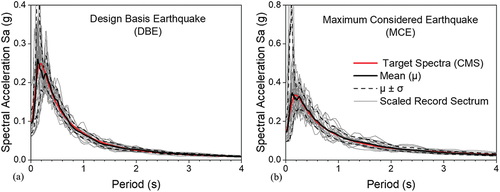
Figure 5. Breakdown of expected losses of a baseline building model for DBE and MCE scenarios.
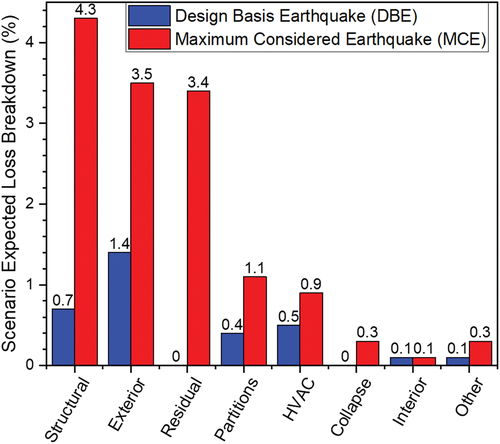
Table 1. Scenario losses, repair time, and recovery time assessment results.
Figure 6. Probability of (a) loss of occupancy at DBE, (b) loss of occupancy at MCE, (c) loss of functionality at DBE, and (d) loss of functionality at MCE, for various preparedness approaches.
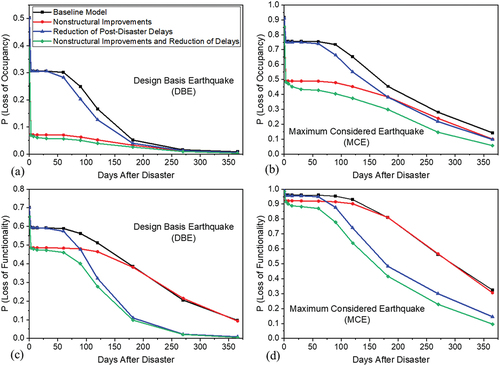
Table 2. Role of impeding factors in post-disaster recovery.
Table 3. Role of reducing post-disaster delays in recovery.