
Figures & data
Figure 1. Investments to reduce the risks of power interruptions without and with resilience-based planning and informed power interruption cost estimates.
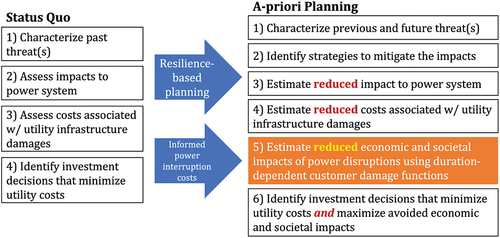
Figure 2. Diagram of the steps of eliciting informed customer interruption cost (CIC) estimates and constructing duration-dependent customer damage functions.
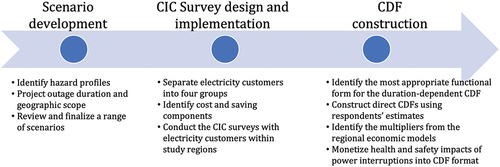
Table 1. Power interruption cost and saving components that need to be elicited from each customer segment. Asterisks indicate the costs or saving components that are not captured in the traditional CIC surveys.
Figure 3. Illustration of elicitation design for residential (top), SMNR/LNR (middle), and public customers (bottom).
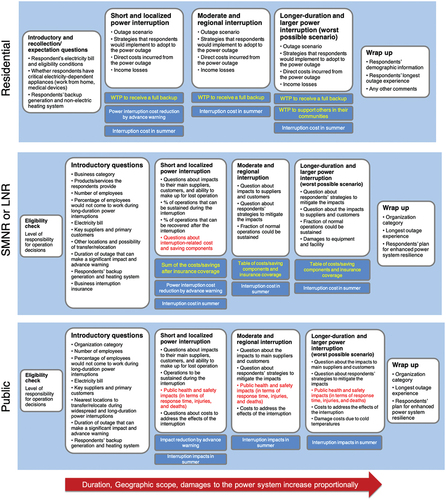
Table 2. Summary of the initiating events and power interruption scenarios.
Figure 4. Distribution of the interruption cost estimates collected from surveys and the fitted quadratic CDFs for the part of Southeast and Interior Alaska.
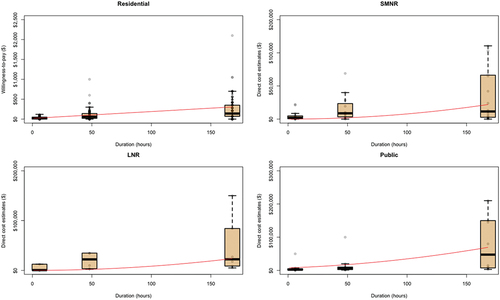
Table 3. Duration-dependent customer damage functions (CDFs) for the direct power interruption costs.
Table 4. Duration-dependent CDFs for the indirect power interruption costs.
Table 5. Expected percent increase in morbidity and mortality provided by the critical private and public organizations in the study regions.
Table 6. Key inputs and assumptions used to determine the health/safety CDFs for the Gulf of Alaska.
Table 7. Summary of the comparison of the islanded communities’ direct and indirect power interruption cost estimates (calculated from the duration-dependent CDFs) and those elicited from San Francisco, California.
Table 8. Summary of the comparison of the islanded communities’ direct and indirect power interruption cost estimates and those elicited from the Village of Rockville Centre, New York.
Public Customer Interview Protocol.pdf
Download PDF (208.2 KB)Large Non-residential Interview Protocol.pdf
Download PDF (260.5 KB)Residential Survey.pdf
Download PDF (276.3 KB)Small and Medium Non-residential Survey.pdf
Download PDF (251.4 KB)Data availability statement
The (anonymized) data supporting this study’s findings are available upon request from the authors.