
Figures & data
Figure 1. The Greater PRD composed of 15 urban areas (this map is based on the standard map with review number GS (2020) 4619 from the Map Technical Review Centre of the Ministry of Natural Resources of China).
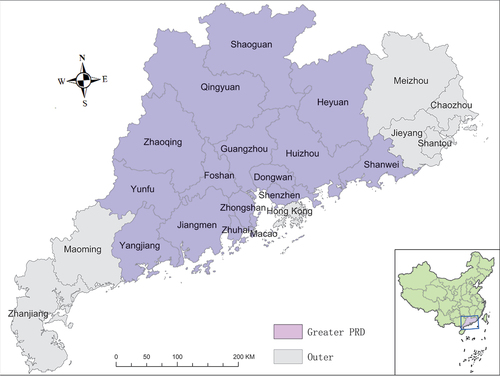
Figure 2. The evolution of industry structure and FDI inflows in the PRD.
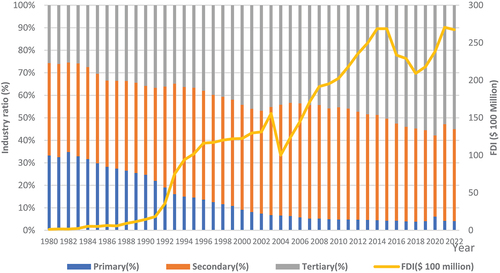
Figure 3. The impact mechanism of FDI on industrial structure.
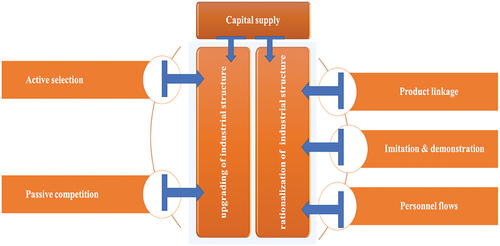
Figure 4. The impact mechanism of the industrial structure on FDI.
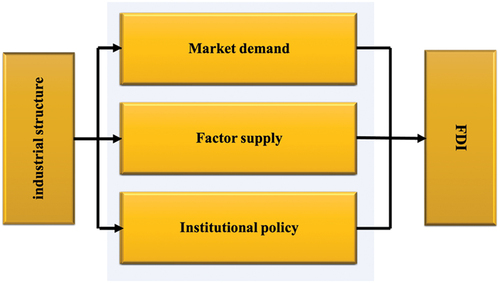
Table 1. Definition of variables.
Table 2. Statistical description of the variables.
Table 3. LLC test for panel data.
Table 4. SEM model results for ISR, ISU and FDI.
Table 5. SDM model results.
Table 6. Total effects decomposition for the ISR and ISU models.
Table 7. Decomposition of the total effect of FDI model.
Table 8. SDM regression results with an inverse distance weight matrix and first-order lagged variables.