Figures & data
Table 1. Organization of the mitochondrial genome of Gyrodactylus gurleyi.
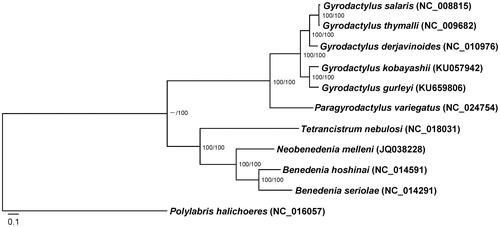
Figure 1. Phylogenetic relationships between Gyrodactylus gurleyi and other 9 monopisthocotyleans based on 3044 concatenated amino acid sequences representing 12 mitochondrial protein-coding genes, with Polylabris halichoeres used as an outgroup. The MtZoa model for maximum-likelihood analysis and MtREV model for Bayes analysis are selected. Scale bar corresponds to the estimated number of substitutions per site. Bootstrap support values in percent units above nodes are displayed as follows: maximum likelihood bootstrap/Bayesian posterior probabilities.