Figures & data
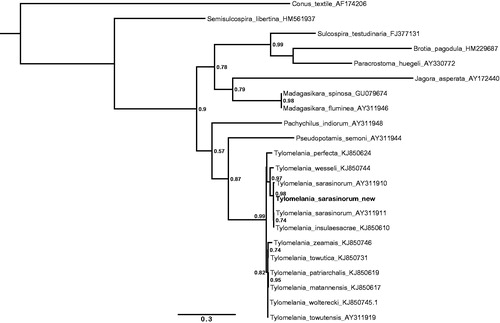
Figure 1. Maximum likelihood tree illustrating the position of the new Tylomelania sarasinorum 16s rRNA gene sequence within a subset of pachychilid species. Tree topology is largely in agreement with earlier work (Koehler & Glaubrecht Citation2010), but fails to resolve clades down to species level in the rapidly radiating genus Tylomelania which is in line with previous results (von Rintelen et al. Citation2004). Sequences were aligned using MAFFT 7.271 and highly divergent or poorly aligned regions were removed with Gblocks 0.91b (Castresana Citation2000) allowing for gap positions and smaller blocks. Trees were calculated using PhyML 3.1 (Guindon et al. Citation2010) with 12 rate categories, optimized equilibrium frequencies, GTR model of sequence evolution and combined heuristics (Nearest Neighbor Interchange and Subtree Pruning and Rerafting).