Figures & data
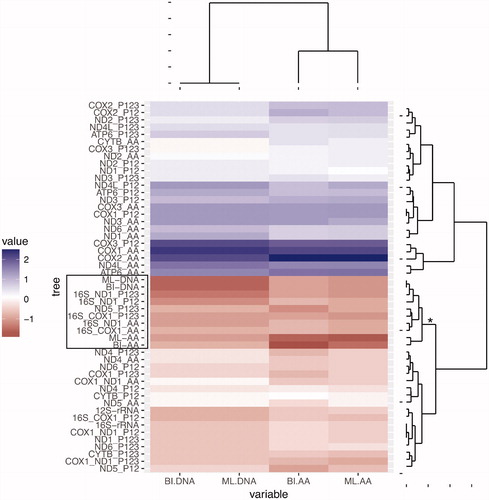
Figure 1. Phylogenetic BI tree of Unionida (freshwater mussels) estimated from 12 concatenated individual mitochondrial nucleotide gene sequences. The phylogenetic tree was inferred using MrBayes (version 3.2.1). The values for branch support are represented in the following order: (1) The Bayesian posterior probabilities for BI-DNA tree, (2) The Bayesian posterior probabilities for BI-AA tree, (3) ML bootstrap support values for ML-DNA, (4) ML bootstrap support values for ML-AA tree, (3), (4). Maximum supporting values (BI =1 and ML =100) are represented with ‘*’. The mitogenomes sequenced for this study are highlighted in the tree inside a box.
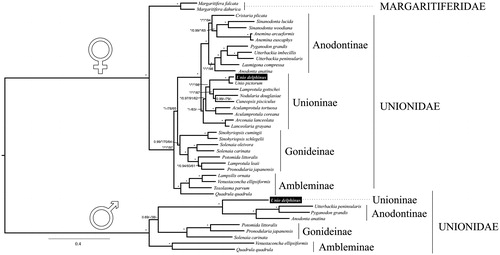
Figure 2. Hierarchical clustering analysis of the nRF distances between all trees inferred in this study (concatenated, single gene and two genes combined). The analysis was performed using the Euclidean distance measure and is represented by a heatmap and dendrograms. The columns of the numeric matrix were centered (by subtracting the column means of the matrix from their corresponding columns) and scaled (by dividing the (centered) columns of the matrix by their standard deviations). The matrix is divided in two major groups/clades. The clade with negative scaled values (lower major clade in the figure) groups trees with smaller nRF distance relative to the mtDNA trees (darker tones correspond to lower negative values that correspond to better trees). The clade with positive scaled values (upper major clade in the figure) groups trees with larger nRF relative to the mtDNA trees (darker tones correspond to higher values that correspond to worst trees). For all individual genes and combination of two genes, we estimated the phylogenetic tree using the amino acid sequences ?_AA?, the first two codon positions ?_P12? or all codon positions ‘_P123’. The phylogenetic analyses of the single gene or combination of two genes were performed using RAxML. The clade that includes all four concatenated trees together with the best single gene tree and combination of two genes are highlighted: (i) gene names are delimited by a box in the heatmap; (ii) in the right side dendrogram, the branch leading to the clade contains an asterisk.