
Figures & data
Table 1. Six primers designed for amplification of either complete or partial fragment of mtDNA COI gene.
Figure 1. Image of the agarose gel showing amplification result of multiplex PCR reaction with the DNA extracted from partially decomposed tissue of a verity of ungulate species as labelled at each lane. (A) PCR amplification with F1, R1, R2 and R3 primers; (B) amplification with F1, F2, R2 and R3 primers; (C) amplification with F1, F2, R2 and R3 and (D) amplification with F1, F2, F3 and R3. Numeric are the base pair size of respective amplicons.
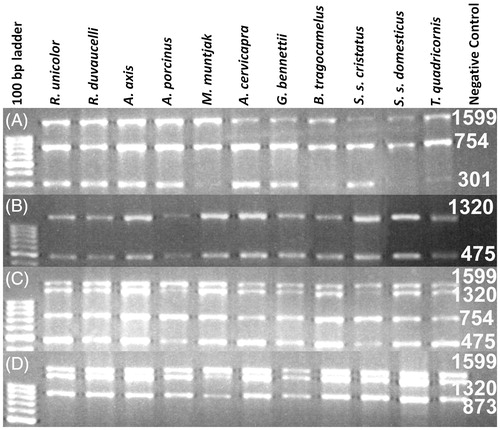
Table 2. All possible combinations of the primers during PCR amplification with tested samples and expected amplicon lengths.
Figure 2. Phylogenetic tree based on neighbour-joining method using MEGA 7. The percentage of replicate trees in which the associated taxa clustered together in the bootstrap test (1000 replicates) are shown next to the branches.
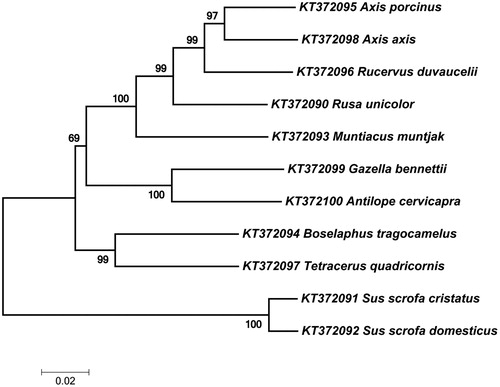
Table 3. List of ungulate species used for validation of primers.