
Figures & data
Figure 1. The BI phylogenetic tree of E. parallelus based on 13 PCGs dataset. The BI phylogenetic tree of E. parallelus. A BI phylogenetic tree was reconstructed using 13 PCGs, GTR + I+G was selected as the best model, and with one Termitidae species as outgroups. Numbers on each node indicate the bootstrap value. Leaf names were presented as species names and Genbank accession number.
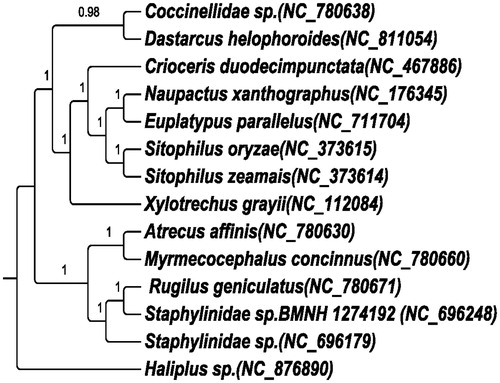
Table 1. Annotation of mitochondrial genome of E. parallelus.