Figures & data
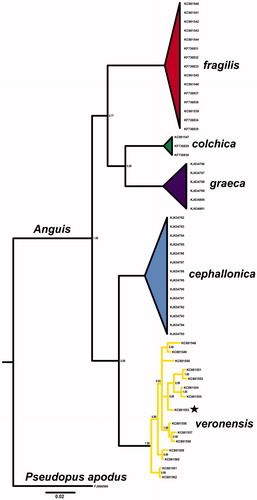
Figure 1. Bayesian phylogenetic tree of Anguis spp. representatives, created with 765 bp of ND2 gene alignment. The tree was created using GTR + I +G model of substitution, as suggested by jModelTest 2.1.10 (Guindon & Gascuel Citation2003; Darriba et al. Citation2012). Tree was generated with 10,000,000 MCMC generations and 25% of burn-in. The individual used for mitogenome sequencing is marked with a star. A homologous sequence of Pseudopus apodus was used as an outgroup. Genbank accession numbers and Bayesian posterior probabilities of nodes are shown on the tree.