Figures & data
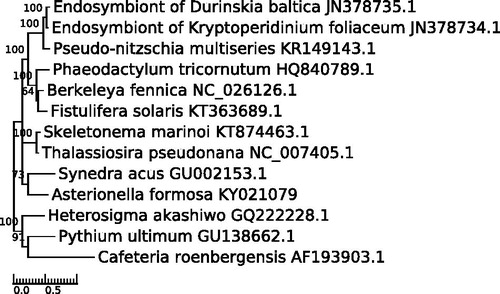
Figure 1. Visualization with TreeGraph (Stöver & Müller Citation2010) of a phylogenetic tree of selected diatoms and stramenopile mitogenomes based on the concatenation of the protein sequences of the following genes : atp6, atp9, cox1, cox2, cox3, nad1, nad2, nad4, nad4l, nad5, nad6, nad7, rpl2, rps12, rps19, rps4, rps8. Alignments were performed with MUSCLE (Edgar Citation2004) and the tree was constructed with PhyML (Guindon et al. Citation2009) 20120412 using the CpREV model, selected by ProtTest 3 (Darriba et al. Citation2011). Bootstrap values of 100 permutations are indicated at the nodes.