Figures & data
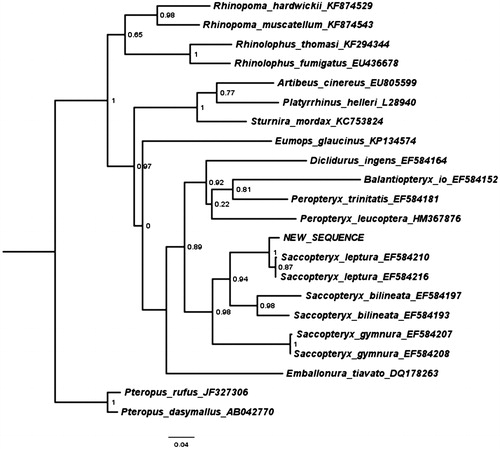
Figure 1. Maximum likelihood tree illustrating the phylogenetic position of the newly sequenced Saccopteryx leptura gene sequence among a subset of bat species. Cytochrome B sequences were aligned using MAFFT 7.271 and highly divergent or poorly aligned regions were removed with Gblocks 0.91b (Castresana Citation2000) allowing for gap positions and smaller blocks. Trees were calculated using PhyML 3.1 (Guindon et al. Citation2010) with four rate categories, optimized equilibrium frequencies, GTR model of sequence evolution and combined heuristics (Nearest Neighbour Interchange and Subtree Pruning and Rerafting).