
Figures & data
Table 1. Polymorphic sites within 15 mtDNA control region haplotypes of Eld’s deer and the distribution of haplotypes in each population.
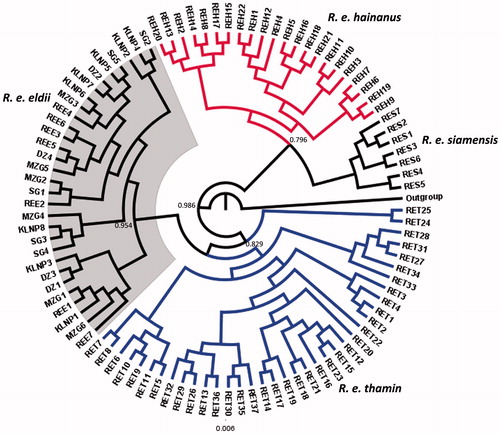
Figure 1. Bayesian (MCMC) consensus tree of 96 Eld’s deer sequences based in the mtDNA control region. Posterior values in percentage are provided at their respective nodes. The Elaphurus davidianus (AF291894) was used as an out group. Gray shade represents clade of captive and wild population of Sangai deer (R. e. eldii).
Supplemental material