Figures & data
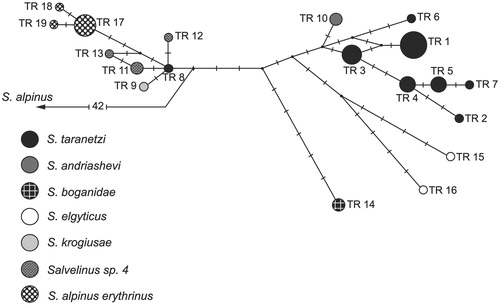
Figure 1. Median-joining network for the charrs of the genus Salvelinus, resulting from the analysis of combined sequences of mtDNA (COI, Cytb genes, and CR). Mutational differences between the haplotypes are shown on the branches; the circle size is proportional to the absolute haplotype frequencies. All mutations have equal weights; the interval of the median vector search (black circles), ɛ is zero.