Figures & data
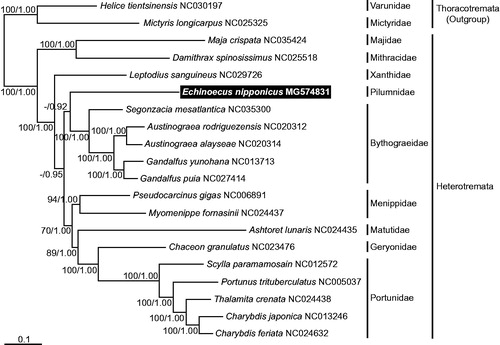
Figure 1. A maximum-likelihood (ML) tree was inferred from the mitogenomic sequences of the representative species belonging to the subsection Heterotremata, with two taxa in the subsection Thoracotremata as outgroups. Phylogenetic analyses were constructed by the sequence matrix based on unambiguously aligning regions of the first and second codon positions of the 11 protein-coding genes. Bootstrap values above 50% in the ML analysis and posterior probabilities above 0.90 in the Bayesian inference (BI) analysis were shown at each node. The symbiotic crab E. nipponicus, which was examined in this study, is highlighted in black.