Figures & data
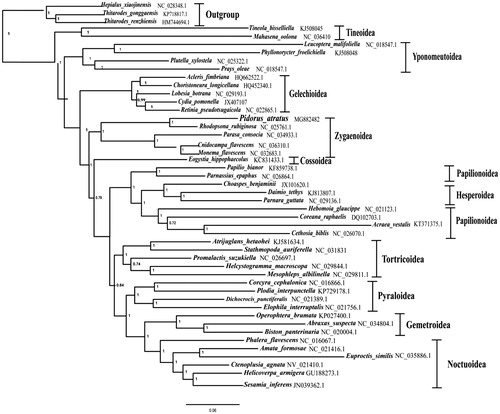
Figure 1. The Bayesian inference (BI) phylogenetic analysis tree of P. atratus and other lepidopterans. Phylogenetic reconstruction was done from a concatenated matrix of 13 protein-coding mitochondrial genes of the mitochondrial genome. The numbers beside the nodes are bootstrap values. Alphanumeric terms indicate the GenBank accession numbers.