Figures & data
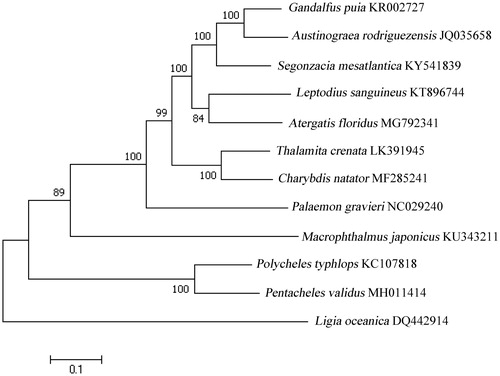
Figure 1. Molecular phylogeny of Pentacheles validus mitochondrial genome based on the maximum likelihood (ML) method using a Kimura 2-parameter model. The bootstrap values are shown at node branches (>50). Initial tree(s) for the heuristic search were obtained automatically by applying Neighbour-Join and BioNJ algorithms to a matrix of pairwise distances estimated using the maximum composite likelihood (MCL) approach, and then selecting the topology with superior log-likelihood value. The tree is drawn to scale, with branch lengths measured in the number of substitutions per site. The analysis involved 12 mitochondrial genome sequences.