Figures & data
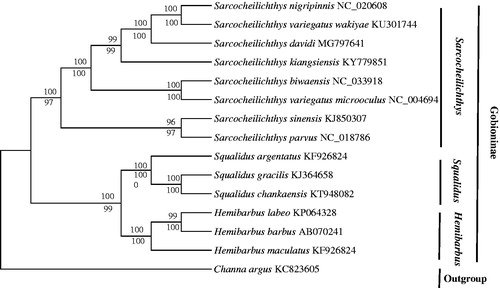
Figure 1. The phylogenetic analyses investigated using maximum likelihood (ML) and neighbour-joining (NJ) methods analyses indicated evolutionary relationships among 15 taxa based on the nucleotide alignments of 13 protein-coding genes. The tree topologies produced by ML and NJ analyses were equivalent. NJ posterior probabilities and ML bootstrap values are shown on the nodes. Channa argus (GenBank: KC 823605) was used as the outgroup.