Figures & data
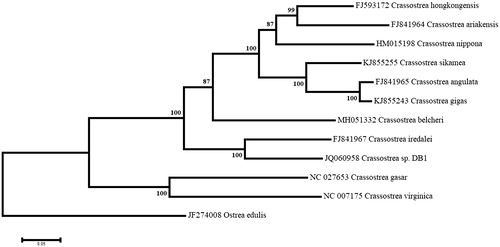
Figure 1. Maximum likelihood phylogeny using the complete mitogenomes of Crassostrea belcheri and other species of oysters, with Ostrea edulis as an outgroup. The tree with the highest log likelihood (−161490.9077) is shown. Numbers next to nodes are support values obtained after 1000 bootstrap replicates.