Figures & data
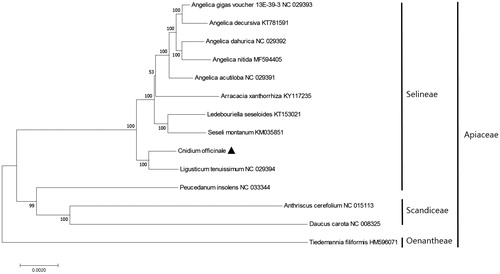
Figure 1. Maximum-likelihood (ML) tree based on the chloroplast protein-coding genes of 14 taxa, including C. officinale and one outgroup taxon. Fifty-nine protein-coding genes were aligned using MAFFT (http://mafft.cbrc.jp/alignment/server/index.html). ML analysis was performed using MEGA6, with 1000 bootstrap replicates (Tamura et al. Citation2013). The bootstrap support values from 1000 replicates are indicated at the nodes.