Figures & data
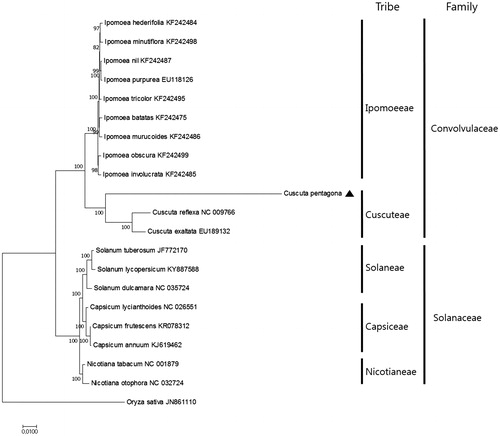
Figure 1. Maximum Likelihood tree based on the chloroplast protein-coding genes of 21 taxa including C. pentagona and Oryza sativa as outgroup. Fifty-nine protein-coding genes were aligned using MAFFT (http://mafft.cbrc.jp/alignment/server/index.html) and used to generate the Maximum Likelihood phylogenetic tree with MEGA 6.0 (Tamura et al., Citation2013). The bootstrap support values (>50%) from 1000 replicates are indicated in the nodes.