Figures & data
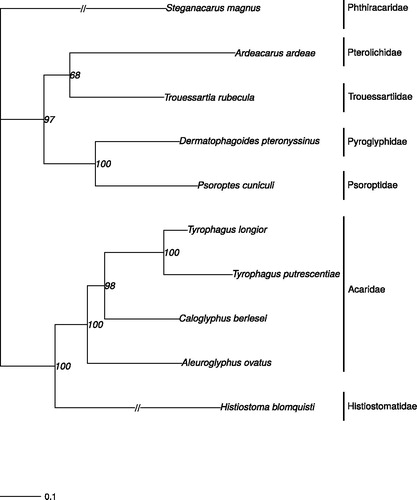
Figure 1. Phylogram based on the mitogenome sequences of Trouessartia rubecula (MH208456; this study) and eight other Astigmata mites (plus an outgroup from Mixonomata). The following mitochondrial genomes were used (accession numbers are in parentheses): Tyrophagus longior (NC_028725), Tyrophagus putrescentiae (NC_026079), Ardeacarus ardeae (KY352304), Dermatophagoides pteronyssinus (EU884425), Psoroptes cuniculi (NC_024675), Caloglyphus berlesei (NC_024637), Aleuroglyphus ovatus (KJ571488), Histiostoma blomquisti (NC_031377), and Steganacarus magnus (NC_011574), which was used as outgroup (Dabert et al. Citation2010). The phylogenetic tree was estimated from 500 bootstrap (BS) replicates in IQ tree. BS support values are indicated at each node and the scale bar indicates nucleotide substitutions per site.